Key Takeaways:
- R-squared analysis is crucial for understanding business relationships like marketing ROI, sales forecasting, and customer behavior patterns, but statistical functions can be intimidating
- Excelmatic's AI approach eliminates complex statistical formulas by letting you calculate R-squared values using simple language commands
- Compared to traditional RSQ(), Excelmatic provides not just the R-squared value but also instant visualizations and business interpretations
- For business professionals, adopting AI tools means faster data insights and more confident decision-making without statistical expertise
If you work with trend lines or need to measure how closely two sets of data relate, calculating the R-squared value is essential. R-squared, or the coefficient of determination, tells you how much of the variation in one variable can be explained by another. It's a key metric in everything from sales analysis to scientific experiments.
In this guide, we'll explore two ways to find the R-squared value in Excel: the classic RSQ() function and a modern, AI-powered approach that delivers insights in seconds.
Method 1: The Traditional Approach with the RSQ() Function
For users comfortable with Excel formulas, the RSQ() function is a simple and direct tool for the job.
What Does RSQ() Do?
RSQ(), short for “R-squared,” returns the square of the Pearson product-moment correlation coefficient between two arrays. In plain terms, it shows how well the values in one range predict those in another. If the RSQ() result is 1, you have a perfect linear relationship. If it’s 0, there’s no linear relationship at all.
People often use RSQ() when they want to check how well a line fits their data, like in regression analysis or when plotting trendlines.
RSQ() Syntax and Arguments
Here’s the structure for RSQ():
=RSQ(known_y’s, known_x’s)
known_y’s: These are your dependent values (the ones you’re trying to predict or explain).known_x’s: These are your independent values (the ones you think might be doing the explaining).
Both ranges must have the same number of data points. If they don’t, RSQ() will return an error.
Important Note: The RSQ() function is designed for simple linear regression, meaning it only accepts one set of independent (x) values. It cannot handle multiple linear regression on its own.
RSQ() Example
Suppose you want to know how well advertising spend predicts sales.
- Column A: Advertising Spend (Independent Variable,
known_x's) - Column B: Sales (Dependent Variable,
known_y's)
Let’s say your data looks like this:
| A | B |
|---|---|
| 100 | 200 |
| 200 | 400 |
| 300 | 600 |
| 400 | 800 |
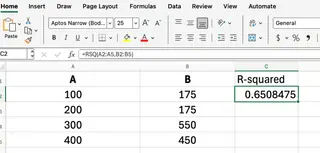
If your data for advertising is in A2:A5 and sales is in B2:B5, you would enter:
=RSQ(B2:B5, A2:A5)

This formula returns the R-squared value, showing how much of the change in sales can be explained by the change in advertising spend. In this perfect example, the result is 1.
Method 2: The AI-Powered Approach with Excelmatic
While the RSQ() function is effective, it requires you to know the formula, its syntax, and which variable is dependent vs. independent. A more intuitive and faster method is to use an AI tool like Excelmatic.

Excelmatic is an Excel AI Agent that understands plain language. Instead of writing formulas, you simply upload your file and ask a question.
Excelmatic Example
Using the same sales and advertising data, the process is much simpler:
- Upload your Excel file to Excelmatic.
- Ask your question in the chat box. For example:
What is the R-squared value between Advertising Spend and Sales?
Excelmatic will instantly analyze the data and provide the R-squared value, without you needing to write a single formula. You could even ask, "How well does advertising spend predict sales?" and the AI will understand to calculate the coefficient of determination.
Comparing the Methods: RSQ() vs. Excelmatic
| Feature | RSQ() Function (Manual) |
Excelmatic (AI-Powered) |
|---|---|---|
| Speed | Requires manually typing the formula and selecting ranges. | Instant results after typing a simple question. |
| Ease of Use | Requires knowledge of the function, syntax, and arguments. | Intuitive; uses natural language, no formulas needed. |
| Error Risk | High. Prone to errors like #N/A or #DIV/0! from incorrect ranges or data types. |
Low. The AI handles data validation and interpretation, reducing user error. |
| Output | Returns a single numerical value. | Can provide the value, generate a chart, and offer further insights in one go. |
Visualizing R-Squared on a Scatter Plot
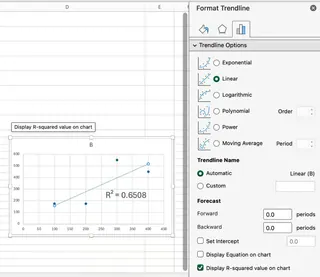
A scatter plot is the best way to visualize the relationship between two variables. The R-squared value is often displayed directly on the trendline.
The Manual Way
In Excel, you would create a scatter plot, add a trendline, and then format the trendline to "Display R-squared value on chart."

While this works, it involves several clicks and can be tedious if you need to create multiple charts.
The Excelmatic Way
With Excelmatic, visualization is part of the analysis. You could ask:
Create a scatter plot for Advertising Spend and Sales with a trendline and the R-squared value.
Excelmatic will generate a complete, presentation-ready chart in a single step, saving you time and effort.
Common Mistakes and How to Avoid Them
Here are a few problems you might run into and how each method handles them.
- Unequal range sizes: With
RSQ(), this returns an#N/Aerror. You must manually fix the ranges. Excelmatic automatically detects column lengths and would either process it correctly or ask for clarification, preventing the error. - Empty or non-numeric cells: The
RSQ()function ignores these, which can skew results without warning. This is a subtle error that's easy to miss. An AI tool is better at identifying and flagging inconsistent or dirty data for your review. - Single data point:
RSQ()needs at least two pairs of numbers to work. A single pair will cause a#DIV/0!error. This is a rare scenario, but AI assistants are generally better at handling edge cases gracefully.
RSQ() vs. CORREL()
It's also useful to know the difference between RSQ() and CORREL().
CORREL()returns the Pearson correlation coefficient (r), which measures both the strength and direction (positive or negative) of a linear relationship. Its value ranges from -1 to +1.RSQ()returns the R-squared (R²), which only measures the proportion of variance explained. Its value is always between 0 and 1.
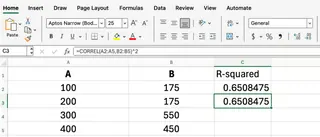
In simple linear regression, you can get the R-squared value by squaring the result of CORREL():
=CORREL(A2:A5, B2:B5)^2

Whether you use RSQ() or an AI tool to get the R-squared value, understanding its relationship with correlation is key to proper interpretation.
Conclusion
Calculating R-squared is a fundamental task in data analysis, and Excel provides powerful ways to do it.
The traditional RSQ() function is a reliable tool for users who are comfortable with Excel formulas and need a quick numerical output.
However, for those who prioritize speed, simplicity, and comprehensive insights, an AI assistant like Excelmatic offers a superior workflow. By translating plain language questions into instant answers, charts, and analyses, it empowers you to focus on what the data means, not on how to write the right formula.
Ready to simplify your data analysis? Try Excelmatic today and discover how AI-powered R-squared analysis can transform your business insights.


