Key Takeaways
- Excel's LINEST function requires advanced statistical knowledge and complex array formulas that overwhelm most business users
- Excelmatic's AI approach eliminates formula complexity - simply describe your regression analysis needs in plain language
- The platform automatically generates key insights and visualizations, saving hours of manual calculation and interpretation
- For sales forecasting, marketing trend analysis, and operational planning, Excelmatic provides instant regression results without technical expertise
Performing linear regression is a cornerstone of data analysis, used for everything from trend analysis to forecasting. Excel has a powerful, albeit complex, tool for this called LINEST(). LINEST() is respected because it calculates the statistics for a straight line that best fits your data using the least squares method and provides deep model insights like the F-statistic and standard errors.
But what if you could get the same powerful insights without wrestling with array formulas and interpreting cryptic output grids?
Keep reading, and we'll show you two ways to master linear regression in Excel: the traditional LINEST() function and a revolutionary AI-powered approach that makes analysis faster and more intuitive.
Method 1: The Traditional Formula - Understanding Excel's LINEST()
Before we try examples, let's get a high-level view of what LINEST() is doing.
LINEST() performs linear regression using the least squares method, which finds the line that minimizes the sum of squared residuals—the squared differences between the observed y-values and those predicted by the line.
Regression is one of the absolute most important things an analyst or data scientist needs to be skilled with. It's used for everything from comparing models and forecasting, to hypothesis testing and causal inference.
Syntax for Excel LINEST()
The syntax for LINEST() is as follows:
=LINEST(known_y's, [known_x's], [const], [stats])
known_y's: The dependent data values (required)known_x's: The independent data values (optional)const: Logical value;TRUEto calculate the intercept,FALSEto force it to zero (optional)stats: Logical value;TRUEto return additional regression statistics,FALSEfor only slope/intercept (optional)
Using Excel LINEST() for Regression
Let’s now look at both the simple linear regression case (one independent variable) and the multiple linear regression case (more than one independent variable).
LINEST() and simple linear regression
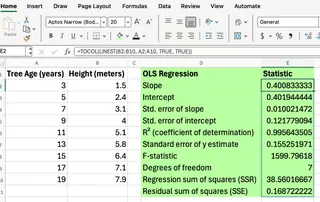
To perform a simple linear regression with one independent variable, you need to provide your y-values and x-values. The challenge here is that LINEST() is an array formula, meaning it outputs data into multiple cells.
=LINEST(B2:B10, A2:A10, TRUE, TRUE)
By setting the optional arguments to TRUE, LINEST() returns a grid of several statistics, as you can see in the image below:
- Slope(s) for each independent variable
- Intercept
- Standard error values
- R-squared value
- F-statistic and degrees of freedom

This 5x2 grid can be confusing to interpret if you're not a statistician. You have to know which number corresponds to which statistic. A common trick is to wrap it inside TOCOL() to get a single column, but you still need to remember the order of the output!
LINEST() and multiple linear regression
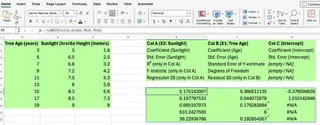
LINEST() can also handle multiple independent variables. You simply expand the known_x's range to include all your independent variable columns.
=LINEST(C2:C10, A2:B10, TRUE, TRUE)

This example calculates regression statistics for y-values in C2:C10 with two independent variables in columns A and B. To avoid confusion, many users create a separate label grid to match up the statistics accurately, which adds another layer of manual work.
Method 2: The AI Way - Instant Regression with Excelmatic
While LINEST() is powerful, it requires memorizing syntax, understanding array formulas, and manually interpreting the output. There's a much simpler way.
Excelmatic is an Excel AI Agent that automates complex tasks like linear regression. Instead of writing formulas, you just ask for what you need in plain language.

Here’s how you'd perform the same regression analysis with Excelmatic:
- Upload your Excel file.
- Ask your question. For a simple linear regression, you could type:
Perform a linear regression with column B as the dependent variable and column A as the independent variable. Show me the key stats and a chart.
For multiple regression, you'd just adjust your request:
Run a multiple regression to predict column C using columns A and B. What is the R-squared and what are the coefficients?
Excelmatic handles the rest, delivering instant answers, charts, and AI-powered insights for fast, accurate reporting.
LINEST() vs. Excelmatic: A Quick Comparison
| Feature | Excel LINEST() |
Excelmatic (AI Agent) |
|---|---|---|
| Ease of Use | Difficult. Requires formula knowledge and is an array formula. | Extremely Easy. Uses plain language commands. |
| Speed | Slow. Manual setup and interpretation required. | Instant. Get results in seconds. |
| Required Knowledge | High. Need to understand syntax, arguments, and statistical output. | Low. No formula or stats expertise needed. |
| Output | A grid of numbers that needs manual interpretation. | Clear summary, key insights, and ready-to-use charts. |
| Error Handling | Prone to errors like #VALUE! or #N/A from mismatched ranges. |
AI-driven, handles data context automatically, reducing errors. |
When to Use Each Method
Use LINEST() when:
- You are an advanced Excel user who is comfortable with array formulas and statistical terminology.
- You need to embed a dynamic regression calculation within a larger, complex financial model.
- You are working in an environment where external AI tools are not permitted.
Use an AI tool like Excelmatic when:
- You want to perform trend analysis, forecasting, or modeling quickly and without errors.
- You prefer to focus on the insights, not on writing and debugging formulas.
- You need to quickly generate charts and summaries for a report or presentation.
- You want to evaluate the strength of relationships between variables in an intuitive way.
Tips for Better Regression Analysis (For Both Methods)
Whether you use LINEST() or an AI tool, some best practices always apply:
- Check for outliers: Always check your data for outliers before running a regression. The underlying OLS method is sensitive to them.
- Get the full picture: With
LINEST(), use thestatsargument. With Excelmatic, ask for "full regression statistics." - Visualize your data: Combine your analysis with charts to tell a richer story. Excelmatic can generate these automatically.
Conclusion
As you've seen, Excel provides different paths to the same goal. The LINEST() function is a testament to Excel's deep analytical capabilities, offering granular control for those willing to learn its complexities.
However, the landscape of data analysis is changing. Excelmatic now offers a more efficient, intuitive, and accessible alternative for business professionals. By handling the complex calculations behind the scenes, it empowers you to move directly from data to decision-making.
Ready to simplify your regression analysis? Try Excelmatic today and experience the power of AI-driven forecasting and trend analysis for your business needs.
Excel FAQs
What is the LINEST function in Excel used for?
The LINEST function performs linear regression analysis to find the line of best fit for your data and returns detailed statistics about the relationship between variables.
How do I interpret LINEST output in Excel?
LINEST returns an array where the first row contains coefficients, the second row has standard errors, and subsequent rows include R-squared, F-statistic, and other metrics. This complex output requires statistical knowledge to interpret correctly.
Can LINEST handle multiple regression in Excel?
Yes, LINEST can handle multiple independent variables by including additional columns in the known_x's range, but the output becomes even more complex to interpret.
What are the advantages of using AI tools like Excelmatic for regression?
AI tools provide instant, interpretable results without requiring statistical expertise, automatically generate visualizations, and handle the technical complexity behind the scenes.
How accurate is AI-powered regression compared to traditional methods?
AI tools like Excelmatic use the same mathematical foundations as traditional methods but provide the results in a more accessible format, making advanced analytics available to non-technical users.


