Key Takeaways
- Building Excel data models traditionally requires advanced technical skills in Power Query and Power Pivot that most business users don't have time to master
- Excelmatic's AI approach eliminates the complexity of data modeling - simply upload your files and describe what analysis you need in plain language
- The platform automatically handles relationships, merging, and calculations that typically take dozens of manual steps and technical knowledge
- For sales, marketing, and operations teams needing quick multi-source insights, Excelmatic provides instant data modeling without the technical overhead
Data models allow us to load, integrate, and analyze data from multiple sources, facilitating a more dynamic and insightful view of the data. This is essential when a single spreadsheet is no longer enough to answer your business questions.
Across sections of this tutorial, we'll explore the traditional ways to create data models in Excel, leveraging powerful tools like Power Query, Power Pivot, and PivotCharts. But we'll also introduce a revolutionary, AI-powered alternative that accomplishes the same goals in a fraction of the time.
Let’s get going!
How to Create a Data Model in Excel
There are two main paths to creating a data model: the modern, AI-powered way and the traditional, manual way.
The Modern Approach: Using an AI Agent like Excelmatic

For ultimate speed and simplicity, Excelmatic is the best choice. Excelmatic is designed to handle complex data tasks using plain language commands. The process is incredibly straightforward:
- Upload your files: Upload all your related data files (e.g.,
Orders.xlsxandProducts.xlsx). - State your request: Ask a question in plain language, like "Combine these files and show me the total quantity sold for each product name."
- Get your result: Excelmatic automatically understands the relationships, merges the data, performs the calculation, and delivers a finished report or chart instantly.
This approach bypasses the complex, multi-step processes of traditional methods, which we will explore next.
The Traditional Approach: Manual Steps in Excel
For those who prefer manual control or want to understand the underlying mechanics, here are the general steps:
- Format your data as tables.
- Create relationships between the tables.
- Use Power Query to load and transform data.
- Use Power Pivot for advanced data modeling.
- Utilize PivotTables and PivotCharts to visualize your data.
When to Use a Data Model in Excel
Creating a data model in Excel is particularly useful in several common scenarios, including data cleansing, data integration and transformation, and complex data analysis. Here are some of the main benefits.
- Facilitates Data Cleansing: Data models help in cleaning and standardizing different data sets to maintain uniformity and consistency. This is critical when dealing with data from different sources, which requires blending and preprocessing.
- Performs or Solves Data Integration and Transformation: With the data model in place, all the data available from any other source can easily be integrated and transformed, and data users can receive a unified view that is easy to process and analyze.
- Enhances Data Visualization: Data models support the development of advanced data visualizations such as PivotCharts and Power View reports.
- Improves Data Security and Management: With a data model, controlled access to different parts of your data can be realized. You will have an easier time managing permissions and data within the model to reduce the risks of unauthorized access and data breaches.
- Streamlines Data Reporting: Through data models, reporting of data can be fully automated, thereby facilitating the reporting and decision making process. This makes it possible for reports and dashboards to be adjusted dynamically in case there is an insertion of new data.
- Handles Large Datasets: The data models can work with big datasets in Excel, overcoming the constraints in traditional Excel worksheets.
- Enables Complex Data Analysis: The feature of creating relationships between multiple data tables allows advanced data analysis that might not be easy with regular Excel functions.
How to Create a Data Model by Importing Data (The Manual Way)
In this section, we will walk through the traditional process of creating a data model in Excel by importing sample datasets. We will use two sample datasets: Order and Product. You can create similar datasets to follow along.
The first step is to import data into Excel. Start by opening a new Excel workbook, and click on the Data tab. Under Get Data, select Get Data > From File > From Excel Workbook.
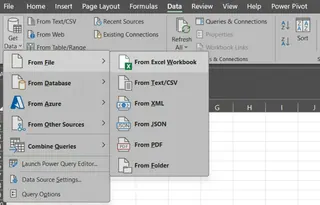
Importing data into Excel. Image by Author
Select theOrder.xlsx workbook, and click on Import. This will open the Navigator window: Select the Sheet1 table.
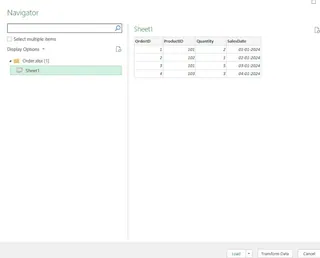
The Navigator window in Excel. Image by Author
Click the Load To option that’ll open the Import Data window. In the dialog box, select Only Create Connection and check Add this data to the Data Model. Click OK.
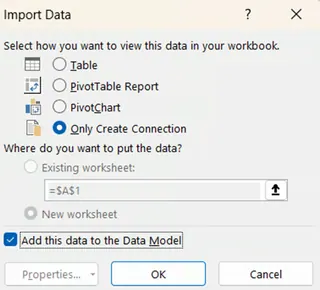
Import Data window. Image by Author
Repeat the above steps to load the Product sheet. Once these two tasks are completed, your Excel workbook will look like this:

Queries & Connections pane. Image by Author
Congratulations! You have imported both the sheets into the Excel file. The next step is to establish relationships between the imported tables. To do this, go to the Data Tools tab and click Relationships.
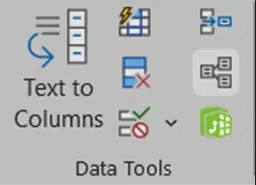
Data Tools tab. Image by Author
A new window will emerge.
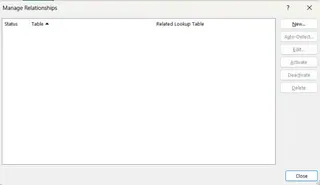
Manage Relationships window. Image by Author
Click New to create a relationship. The Create Relationship pop-up will open. Define the relationship as shown below.

Create Relationship window. Image by Author
Click OK. The relationship is established, and you can confirm it in the Connections tab.

Queries & Connections pane. Image by Author
The next stage is to create the PivotTable. Go to the Insert tab and click PivotTable. Then, in the PivotTable dialog box, select Use this workbook’s Data Model.
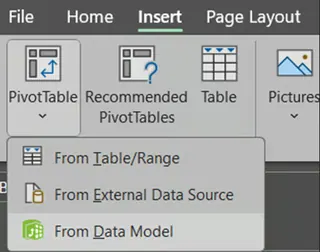
PivotTable dialog box. Image by Author
Select the location for the PivotTable. Click OK. The PivotTable will open and you can see the fields under the PivotTable Fields.

PivotTable Fields. Image by Author
To build the PivotTable, drag fields to the Rows and Values areas:
- Rows: ProductName
- Values: Quantity
The resulting PivotTable will look like this:
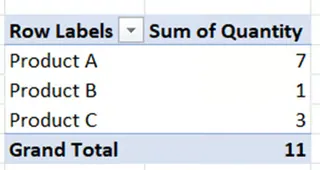
PivotTable Fields pane. Image by Author
The Excelmatic Advantage: From 15 Clicks to 1 Prompt
The 15+ step process above is powerful, but complex and time-consuming. With Excelmatic, you can achieve the same result in seconds.
- Upload
Order.xlsxandProduct.xlsx.- Ask: "Using ProductID to link the files, show me the total quantity for each ProductName."
That's it. Excelmatic handles the connection, relationship, and PivotTable creation automatically, giving you the final answer instantly.
How to Create a Data Model Using Power Query (The Manual Way)
For this section, we’ll be using the data stored in the Excel file named, Sample_Data. This file is also available in the same link provided in the previous section. There are two tables in the sheet named, Data.
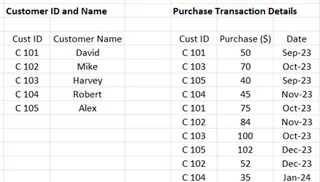
Excel tables to join. Image by Author
We’ll build data models in this existing Excel sheet. To begin, select any cell within the Customer ID and Name table and then select Ctrl + T.

Selecting a cell. Image by Author
This opens a Create Table pop-up.
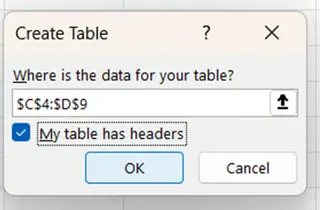
Create table pop-up. Image by Author
Click OK. Now let’s give a name to this table. Go to the Table Design contextual window and under Table Name, rename the table to CustomerPQ.

Table Design context window. Image by Author
Repeat the process for the second table. This time, set the name to PurchasePQ.
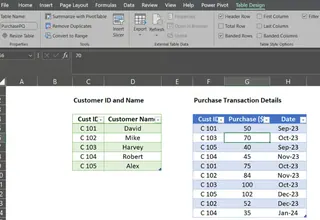
Two tables in Excel ready for Data Model. Image by Author
Now, with the PurchasePQ table active, go to Data, and select From Table Range. This will open the Power Query Editor.
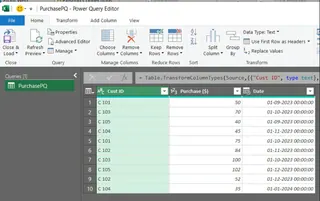
Opening the Power Query Editor. Image by Author
To create a connection and add the table to the Data Model, click on the drop-down tab of Close & Load, and select Close & Load To…
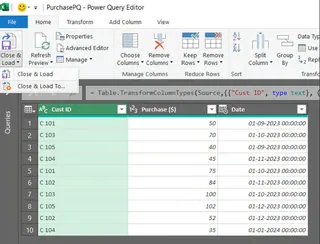
Closing the Power Query Editor. Image by Author
In the Import Data window, select Only Create Connection and check Add this data to the Data Model.
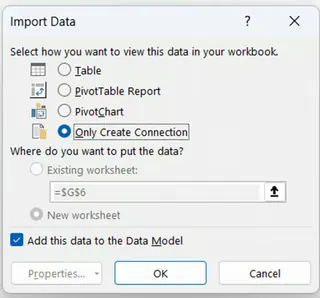
Import Data window. Image by Author
Repeat this entire process for the CustomerPQ table. Once done, the Queries & Connections tab will display both tables.

Queries and Connections. Image by Author
Now we are ready to establish relationships. Within the Data tab, go to the Data Tools section, and click on Manage Data Model.
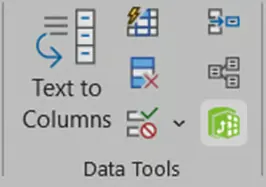
Data Tools. Image by Author
This will open Power Pivot for Excel. Click on the Diagram View.
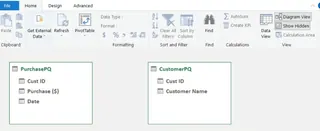
Diagram View. Image by Author
You can see there are two tables, but not connected yet. Go to the Design tab and click on Create Relationship.

Design tab. Image by Author
A new window will open. Fill in the details to link the tables by Customer ID.
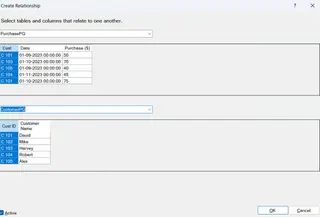
Create a Relationship window. Image by Author
Click OK. The relationship is now established.
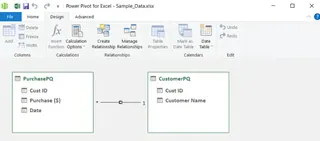
Window showing Relationship is established. Image by Author
Finally, you can insert a PivotTable from the Data Model and drag Customer Name to Rows and Purchase to Values to get your summary report.
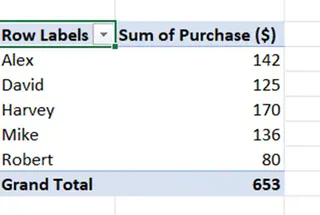
PivotTable Output. Image by Author
The Excelmatic Advantage: Skip the 20+ Clicks
Power Query is a fantastic tool, but as you can see, it requires navigating multiple menus and windows. Excelmatic simplifies this entire workflow.
- Upload the
Sample_Data.xlsxfile.- Ask: "Based on the two tables in the sheet, what is the total purchase for each customer name?"
You get the same result without ever opening Power Query or Power Pivot.
How to Create a Data Model Directly in Power Pivot
This method is similar to the Power Query approach but initiates directly from the Power Pivot tab.
To begin, go to the sheet named Power Pivot in the sample data file, and create tables for our two records, naming them CustomerPP and PurchasePP.
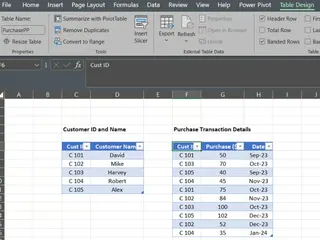
Data Tables from the records. Image by Author
The next step is to add these tables to the data model. Select the CustomerPP table, go to the Power Pivot tab, and select Add to Data Model.
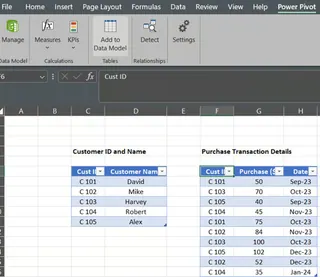
Add to Data Model under PowerPivot. Image by Author
This will open a Power Pivot for Excel pop-up.
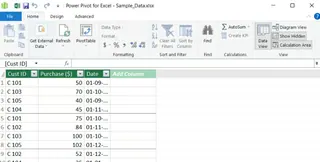
Power Pivot for Excel pop-up. Image by Author
Save and close this window. Repeat the same process for the PurchasePP table. Once both tables are in the model, you can establish the relationship between them using the Diagram View and Create Relationship dialog, just as we did in the Power Query section.

Relationships are established. Image by Author
From here, creating a PivotTable is easy. The end output will be the same summary report we've seen before.
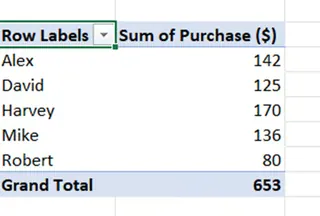
PivotTable summary. Image by Author
How to Create a Visualization with PivotChart
Once you’ve created the PivotTable through any of the manual methods, it’s easy to insert a PivotChart. With the PivotTable selected, go to the Insert tab.

PivotTable summary. Image by Author
Click on PivotChart, select the chart type you want (like a bar chart), and click OK.
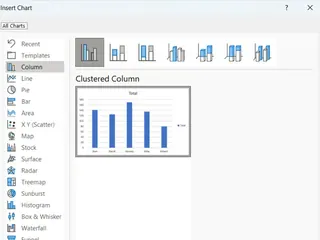
Insert Chart options. Image by Author
This will create the following PivotChart.

PivotChart visualization. Image by Author
The Excelmatic Advantage: Get Charts Directly
Why create a table just to make a chart? With Excelmatic, you can skip the intermediate step and get your visualization directly.
After uploading your files, simply ask: "Create a bar chart showing the total purchase amount for each customer."
You get a presentation-ready chart in one step.
Common Excel Data Model Questions and Issues
While powerful, manual data modeling can lead to issues. Here are some common problems and solutions.
What should I do if a data model issue is preventing Microsoft Excel from opening a workbook?
This can occur due to corruption or compatibility problems.
- Open in Safe Mode: Hold the Ctrl key while starting Excel.
- Check for Updates: Ensure Excel is up to date (File > Account > Update Options).
- Repair Office: Use the Office repair tool from the Control Panel.
- Disable Add-ins: Go to File > Options > Add-ins and disable all add-ins.
How can I troubleshoot errors in the data model?
- Check Data Types: Ensure columns used for relationships are consistent (e.g., both are numbers).
- Validate Relationships: Double-check that relationships are defined correctly between the right columns.
- Review Calculations: Check calculated columns and DAX measures for errors.
- Refresh Data: Ensure all data connections are updated.
Many of these issues arise from the complexity of the manual process. AI tools like Excelmatic manage these connections and calculations behind the scenes, significantly reducing the risk of such errors and saving you valuable troubleshooting time.
Final Thoughts
Thanks for completing the tutorial! You've learned the traditional, powerful methods for creating data models in Excel, a crucial skill for serious data analysis. Mastering Power Query and Power Pivot gives you granular control over your data.
At the same time, you've seen how Excelmatic is revolutionizing this process. For speed, efficiency, and ease of use, the AI-powered way is often superior. It automates the tedious steps, allowing you to move from raw data to critical insights in seconds.
The best tool depends on your needs. For deep, manual data transformation, the classic tools are excellent. For fast, accurate reporting that empowers business teams to make data-driven decisions without technical expertise, Excelmatic is your best bet.
Ready to transform how you work with multi-source data? Try Excelmatic today and experience the power of instant data modeling without the complexity.
What is a data model in Excel, and how is it useful?
With a data model in Excel, it is possible to join data from multiple sources (like different tables or files) into a single, cohesive dataset. This enables you to perform complex analysis and create reports (like PivotTables) that would be impossible with a single flat table.
Can I update my data model if my source data changes, and how do I do it?
Yes. In the traditional method, you go to the Data tab and click Refresh All. This updates your model and any connected PivotTables. With an AI tool like Excelmatic, you typically just upload the new file(s) and ask your question again.
Can I use data from external databases in my Excel data model?
Yes, Excel's "Get Data" feature supports connecting to external databases like SQL Server, Oracle, and others. This is a scenario where the traditional method's direct connectors are very powerful. Excelmatic primarily works with uploaded files.
How do I remove a table from the data model?
To remove a table manually, open the Power Pivot window (Data > Manage Data Model), right-click the tab for the table you want to remove, and select Delete. In an AI workflow, you simply don't upload the file you wish to exclude.
What are the benefits of using Power Query vs. an AI tool?
Power Query offers granular, step-by-step control over data transformations, which is ideal for highly complex and unique cleaning tasks. An AI tool like Excelmatic provides the same results for most common tasks (merging, summarizing, cleaning) with far less effort, using natural language instead of a graphical interface.


