Key Takeaways
Traditional Excel workflows (Power Query/PivotTables) cannot be considered automated; maintaining their operation consumes a significant amount of human time and energy.
Undeniably, more than half of data work wastes time in the data preparation stage, resulting in a lack of high-value analysis and insights.
The new generation of AI tools has upgraded and transformed Excel from a "process" to a "goal," truly automating the process.
In the data-driven era, data speaks volumes, and effectively handling Excel data reports is crucial for decision-making. But how do you create reports?
Most people, including myself, probably first think of functions, Power Query, and pivot tables. These can solve our data processing problems most of the time, but the biggest problem with this approach is its cumbersome steps; every data change requires adjusting the functions.
When problems arise, troubleshooting and corrections need to be done from scratch, which consumes a lot of time.
It's no wonder some say that we spend 80% of our energy on the mechanical labor of merging, cleaning, and aligning data, with less than 20% of our time actually spent on analysis and insight. Now, it's time to break this cycle.
Limitations of Traditional Workflows
To understand the breakthrough of next-generation AI methods, we can first review traditional workflows. Each step of the traditional workflow suffers from significant inefficiencies:
Data Integration: Merging multi-source tables using Power Query requires manually configuring a series of query steps, a cumbersome process easily interrupted by changes in source data.
Data Cleaning: Processing logic and rules established using functions like
TRIMandSUBSTITUTElack flexibility and cannot handle abnormal data such as formatting errors.Data Analysis: Functions like
SUMIFSandVLOOKUPare too rigid. While pivot tables offer multidimensional analysis capabilities, their interactivity is limited, failing to meet the needs for flexible and rapid real-time queries.
It's easy to see that traditional workflows involve humans serving machines, while AI-driven automation allows machines to serve humans.
AI-Driven Excel Automation
Currently, many AI tools for solving Excel problems have emerged. I've personally tried several and found that each has its own advantages and disadvantages. However, one product that truly impressed me—"excelmatic"—achieves a good balance between ease of use and professionalism.
Through simple dialogue, it can complete the entire workflow from merging multiple tables and cleaning data to complex calculations and chart generation. Below, I will demonstrate how this new work paradigm works.
Step 1: Data Fusion and Preprocessing
No separate query scripts need to be configured. Simply upload the file and issue the following instructions:
"Merge these three tables. Use 'Order ID' as the primary key to remove duplicates, standardize the 'Order Date' column to YYYY-MM-DD format, and ensure the 'Sales Amount' column is a pure numeric type."

AI can directly understand the business intent behind the instructions and autonomously complete data alignment and standardization. This replaces the previously fragmented and linear operational steps.
Step Two: Exploratory Analysis
Once the data is ready, the analysis process naturally becomes easier. You can ask any questions without using functions or formulas. For example:
Question: "Group by 'Sales Region' and summarize 'Sales Revenue' and 'Profit'."
Question: "From the above results, identify the top 10 products in terms of 'Profit' and calculate their profit contribution."
Question: "Switch the analysis perspective and calculate the average order value and total order volume by 'Sales Manager' dimension."
This conversational communication analysis effectively overcomes the shortcomings of traditional analysis methods, giving analysts more room for thought and providing a more comprehensive analysis.
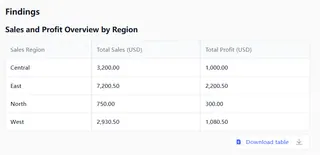
Step 3: From Data to Insights
The value of AI lies not only in calculation, but also in visually representing data. For example:
"Generate bar charts for sales figures in each region."
"Based on the current profit analysis table, generate a two-sentence summary indicating the best-performing regions and products."
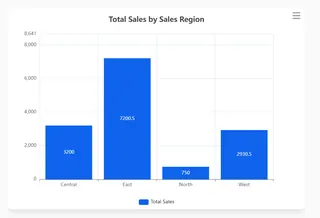
Chart visualization provides more concrete evidence for your insights and analysis.
From Executor to Strategy Analyst
Two different data analysis approaches redefine the analyst's role:
Traditional Approach: The analyst is the executor of the tool, their value lying in their control over the details of the tool's process.
AI Approach: The analyst is the questioner of the business, their value lying in asking the right questions and making high-quality decisions.
True "automated reporting" doesn't ultimately aim to make machines repeat human actions faster, but rather to free people from low-level execution tasks, allowing them to focus on higher-level strategic thinking. Once the burden of data preparation is lifted, analysts can truly begin answering the key questions driving business growth.
Frequently Asked Questions (FAQ)
1. How is the security of uploading company data to an AI platform guaranteed? Professional tools (such as Excelmatic) typically employ bank-grade encryption measures. When selecting a platform, always review its security protocols. For highly sensitive data, prioritize solutions that offer private deployment.
2. Will AI tools completely replace Power Query and VBA? They are complementary, not replacements. Power Query/VBA are the "engineers" that build stable data pipelines, while AI tools are agile "analyst assistants," adept at handling changing and ad-hoc analytical needs.
3. How can I verify the accuracy of AI calculation results? AI calculation results need to be verified. Excellent tools (such as Excelmatic) allow you to see every step of the process, ensuring process traceability.
Try excelmatic for free now and experience the value leap from tedious execution to strategic insight.


