Key Takeaways
- Stop struggling with complex statistical tests to compare marketing campaigns, sales regions, or product performance
- Excelmatic's AI understands your business questions and runs the right analysis automatically
- Go from data to insights in one step instead of navigating Excel menus and dialog boxes
- Get statistically valid answers about what really drives your key metrics
Statistical analysis is fundamental to data-driven decision-making in various fields, including business, healthcare, education, and scientific research. One commonly used statistical method is the Analysis of Variance, or ANOVA.
While specialized software like SPSS or SAS exists, Microsoft Excel provides a powerful and user-friendly platform for conducting ANOVA. However, the traditional process can still involve multiple steps. Today, AI-powered tools are revolutionizing how we interact with data, offering a much faster and more intuitive alternative.
This guide will simplify the process of conducting ANOVA in Excel by comparing two powerful methods: the classic Data Analysis ToolPak and the modern AI-driven approach with Excelmatic. We’ll provide clear, step-by-step instructions for both, helping you confidently perform and interpret ANOVA tests, regardless of your skill level.
What is ANOVA?
ANOVA is a statistical method used to determine if there are significant differences between the means of three or more independent groups. It's an extension of the t-test, which is used to compare the means of just two groups.
ANOVA works by comparing the variance within each group to the variance between the groups. If the between-group variance is significantly larger than the within-group variance, it suggests that at least one group mean is different from the others.
Broadly speaking, there are two types of ANOVA:
- One-Way ANOVA: Examines the effect of a single independent variable (or factor) on a dependent variable by comparing the means of three or more groups.
- Two-Way ANOVA: Evaluates the impact of two independent variables simultaneously and examines their interaction.
Academic researchers use these tests to analyze the results of controlled studies, such as comparing the efficacy of different treatments. In business, ANOVA can drive decisions by comparing customer satisfaction scores across service centers or the performance of different ad campaigns.
Two Powerful Ways to Perform ANOVA in Excel
Calculating ANOVA by hand is a tedious, multi-step process involving sums of squares, degrees of freedom, and F-ratios. This is why software is the preferred method. In Excel, you have two main options.
- The Traditional Method: Excel's Data Analysis ToolPak. A built-in add-in that provides a suite of statistical tools. It’s reliable but requires manual setup and navigation through several dialog boxes.
- The AI-Powered Method: Excelmatic. A modern Excel AI agent that allows you to perform complex analyses by simply asking questions in plain language. You upload your file, state your request, and the AI handles the entire process—from data recognition to generating the final report.
Let's explore how to perform a One-Way ANOVA using both methods.
One-Way ANOVA: A Practical Example
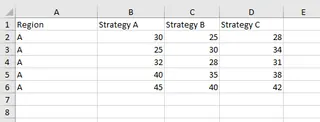
Imagine you’re a data analyst at a marketing agency tasked with analyzing the performance of three marketing strategies (A, B, and C) on sales revenue. You've collected sales data from five similar companies for each strategy.
Your goal is to determine if there is a significant difference in the mean sales revenue generated by these strategies.
Here is the data:
Method 1: Using the Data Analysis ToolPak
Before you can use this method, you first need to ensure the Data Analysis ToolPak is enabled.
How to Enable the Data Analysis ToolPak
The ToolPak isn't enabled by default. Check under the Data tab for the Data Analysis icon.

If you don't see it, follow these steps:
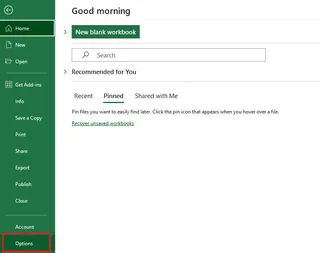
- Click File > Options.
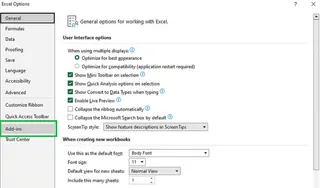
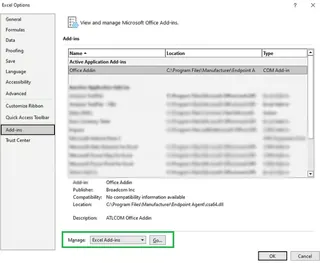
- In the Excel Options dialog box, select Add-ins.
- At the bottom, in the Manage box, select Excel Add-ins and click Go.
- Check the Analysis ToolPak box and click OK.
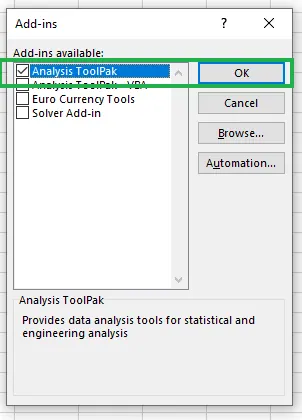
Now, the Data Analysis icon will appear in your Data tab.
Performing the One-Way ANOVA
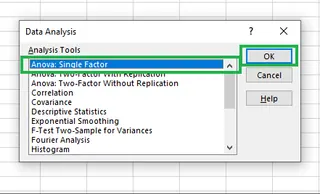
- Click on the Data Analysis icon.
- Select Anova: Single Factor from the list and click OK.
- In the dialog box, configure the options:
- Input Range: Select your data, including the headers (e.g.,
$B$1:$D$6). - Grouped By: Choose Columns since each strategy is in a separate column.
- Labels in first row: Check this box because our selection includes the "Strategy A/B/C" headers.
- Output Range: Select a cell where you want the results to appear (e.g.,
$A$9).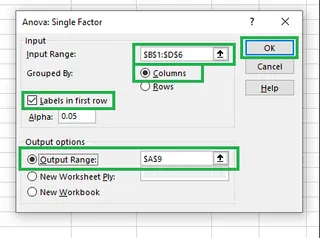
- Input Range: Select your data, including the headers (e.g.,
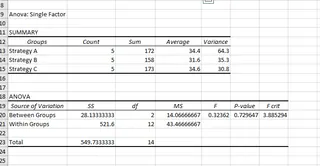
- Click OK. Excel will generate the ANOVA summary table.
You've successfully performed a One-Way ANOVA. Now let's see the AI approach.
Method 2: The Instant AI Approach with Excelmatic

With Excelmatic, the process is dramatically simplified. There are no add-ins to enable or dialog boxes to configure.
- Upload your Excel file to Excelmatic.
- Ask your question in plain language. For this example, you would simply type:
Perform a one-way ANOVA to determine if there is a significant difference in sales revenue between Strategy A, Strategy B, and Strategy C.
Excelmatic analyzes your data, understands the context, performs the ANOVA calculation, and instantly provides the results table with a clear business interpretation.
Comparison:
| Feature | Data Analysis ToolPak | Excelmatic (AI Agent) |
|---|---|---|
| Setup | Requires one-time enabling of the add-in. | None. Just upload your file. |
| Process | Navigate menus, fill a dialog box, define ranges manually. | Type one simple instruction in plain language. |
| Speed | Fast, but involves multiple clicks and configurations. | Instant. Ask and receive. |
| Intelligence | Requires user to know which test to select and how to set it up. | Understands the user's intent from natural language. |
| Interpretation | Manual analysis of P-values and F-statistics | Automatically explains results in business terms |
While the ToolPak is a capable feature, Excelmatic removes all the friction, making sophisticated statistical analysis accessible with zero setup.
Interpreting the One-Way ANOVA Results
Both methods produce a similar output table. To understand it, we need to consider hypothesis testing.
- Null Hypothesis (H0): There is no significant difference in the mean sales revenue among the three marketing strategies.
- Alternative Hypothesis (Ha): At least one strategy has a different mean sales revenue.
We use the P-value to test our hypothesis. A common significance level (alpha) is 0.05.
- If P-value < 0.05, we reject the null hypothesis. There is a significant difference.
- If P-value ≥ 0.05, we fail to reject the null hypothesis. There is no significant difference.
Looking at the results table:
The P-value is 0.73. Since 0.73 > 0.05, we fail to reject the null hypothesis. This means there is not enough statistical evidence to conclude that the three marketing strategies produce different sales revenues.
Another value is the F statistic (0.32) versus the F crit (3.88). If F > F crit, we would reject the null hypothesis. Since 0.32 < 3.88, our conclusion remains the same.
Two-Way ANOVA: A Practical Example
Let's extend our analysis. The company now wants to know if sales are affected by the region (Region A vs. Region B) in addition to the marketing strategy. They also want to check for an interaction effect between strategy and region.
The updated dataset looks like this:
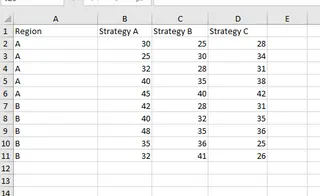
We now have two factors (Strategy and Region), so we need a Two-Way ANOVA.
Method 1: Using the Data Analysis ToolPak
- Go to Data > Data Analysis.
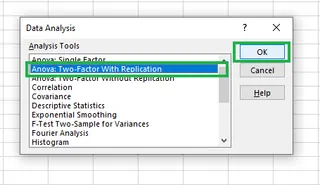
- Select Anova: Two-Factor With Replication and click OK. We choose "With Replication" because we have multiple data points (five) for each combination of strategy and region.
- In the dialog box:
- Input Range: Select the entire data table, including row and column headers (e.g.,
$A$1:$D$11). - Rows per sample: Enter
5, as there are five sales figures for each region/strategy combination. - Output Range: Select a cell for the results (e.g.,
$A$14).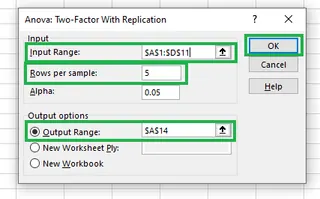
- Input Range: Select the entire data table, including row and column headers (e.g.,
- Click OK.
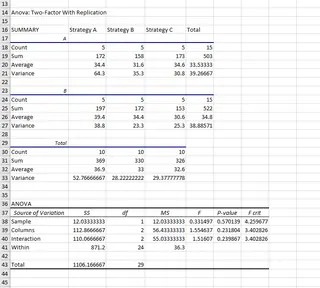
Excel generates the detailed Two-Way ANOVA results.
Method 2: The Instant AI Approach with Excelmatic
Again, Excelmatic streamlines this complex task into a single command.
- Upload the file with the two-factor data.
- Ask your question:
Perform a two-way ANOVA with replication to analyze the effect of marketing strategy and region on sales revenue. Also, check for an interaction effect.
Excelmatic processes the request, identifies the two factors, runs the analysis, and delivers the complete summary table with clear explanations of what the results mean for your business decisions.
Interpreting the Two-Way ANOVA Results
The output table now tests three hypotheses:
- Sample (Region): Is there a difference in mean sales between Region A and Region B?
- Columns (Strategy): Is there a difference in mean sales among the three strategies?
- Interaction: Does the effect of the strategy depend on the region?
We look at the P-values for each:
- Sample (Region): P-value = 0.58
- Columns (Strategy): P-value = 0.79
- Interaction: P-value = 0.92
All three P-values are much greater than 0.05. Therefore, we fail to reject the null hypothesis in all three cases. Our analysis shows no significant difference in sales based on region, strategy, or any interaction between the two.
Conclusion
ANOVA is an essential statistical tool, and Excel remains a go-to platform for performing it.
The traditional Data Analysis ToolPak is a robust, built-in feature that gets the job done once you learn its steps and settings. It represents the classic, manual approach to data analysis within Excel.
However, for marketing managers, sales directors, and operations leaders who need answers fast without statistical training, AI-powered tools like Excelmatic represent the future. By allowing you to use simple language commands, Excelmatic eliminates technical setup, reduces complexity, and delivers business insights instantly.
Stop letting statistical complexity slow down your decision-making. Whether you're comparing marketing campaigns, evaluating sales regions, or testing product variations, Excelmatic gives you the statistical confidence you need without the technical headache.
Try Excelmatic today and experience how AI can transform your Excel data analysis. Upload your spreadsheet and get ANOVA results in plain language - no training required!

