Key takeaways:
- Traditional Excel slicers, while visual, are time-consuming to set up, manage, and use for complex filtering, often cluttering your dashboard.
- Excel AI tools like Excelmatic replace this manual process, allowing you to filter pivot tables, charts, and data by simply describing your request in plain language.
- Using Excelmatic for conversational filtering is significantly faster, more flexible for answering ad-hoc questions, and eliminates the need to manually create, position, and connect slicer objects.
Problem background & pain points
You've done the hard work. You’ve collected your data—perhaps years of film award nominations, sales records, or project milestones—and organized it into a powerful Excel pivot table. It's all there, summarized and ready for analysis.
But now comes the "death by a thousand cuts": the endless requests to see the data in different ways. Your manager asks, "Can you show me just the winners from 2015?" You click the slicer. "Okay, now add 2016." You hold down Ctrl and click again. "Actually, let's compare winners and nominees, but only for the 'Best Picture' category across all years." You're now clicking multiple slicers, carefully ensuring you have the right combination.
Each new question sends you back to your screen, clicking and un-clicking buttons. Your once-clean dashboard is now cluttered with multiple slicer boxes for Year, Category, and Status. While slicers are a huge improvement over the old drop-down filters, they are still a fundamentally manual and reactive way to explore data. You've built a static dashboard for a dynamic world of questions.
The Traditional Excel Solution: Slicers and Their Limits
For years, slicers have been the go-to tool for creating interactive reports in Excel. They provide a user-friendly, visual way to filter pivot tables, charts, and Excel Tables without needing to open the clunky filter drop-down menus.
The process is straightforward:
- Click anywhere inside your pivot table.
- Go to the
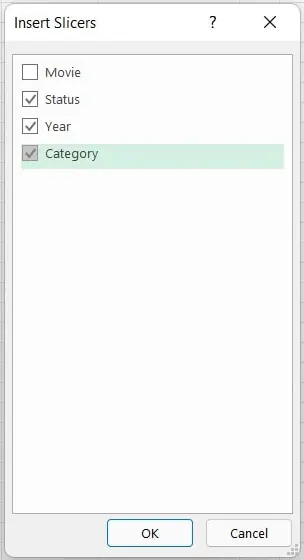
Inserttab on the ribbon and clickSlicer. - In the "Insert Slicers" dialog box, check the boxes for the fields you want to filter by, such as 'Year' or 'Status'.
- Click
OK, and Excel adds slicer objects to your worksheet, which you can then click to filter your data.
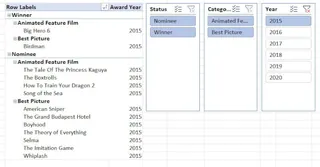
For example, to see only the 2015 results in a film awards pivot table, you would simply click "2015" in the Year slicer. The pivot table instantly updates. This is undeniably useful.
However, this manual approach reveals its limitations as your analysis becomes more complex.
The Hidden Costs of Manual Slicers
- Setup and Clutter: For every dimension you want to filter (Year, Region, Product, Status), you need to insert, position, and resize a separate slicer. A dashboard designed for deep analysis can quickly become a patchwork of slicer boxes, sacrificing valuable screen real estate.
- Rigid Connections: You can connect one slicer to multiple pivot tables, which is powerful for dashboards. However, this is a manual process hidden in the "Report Connections" menu. It also has a strict requirement: all pivot tables must be based on the exact same data source. If they're not, it simply won't work.
- Limited by Ad-Hoc Questions: Slicers are perfect for pre-defined questions. But what if your manager asks something unexpected? "Show me winners from the last 3 years, but only in categories that don't involve acting." There's no slicer for that. You're forced back to creating complex manual filters or manipulating your source data.
- Maintenance Overhead: As data changes or new categories are added, slicers may need to be refreshed, restyled, or even recreated. Maintaining a complex dashboard with many slicers is a recurring task.
Slicers are a tool for displaying filtered data, not for exploring it conversationally. For that, you need a new approach.
The New Solution: Excel AI with Excelmatic
Instead of clicking buttons, what if you could just tell Excel what you want to see? This is the promise of Excel AI agents like Excelmatic. It transforms data analysis from a manual, point-and-click task into a simple conversation.

You upload your data file, and then you chat with the AI in plain language to filter, analyze, and visualize your data. It handles the pivot tables, formulas, and charts for you.
Step-by-Step: Interactive Filtering with Excelmatic
Let's solve the same film awards analysis problem, but this time with Excelmatic.
1. Upload Your Data
First, drag and drop your Excel or CSV file containing the film award data into Excelmatic. The AI will instantly read and understand your data structure, including columns like 'Year', 'Category', 'Film Title', and 'Status'.

2. Ask for What You Want in Plain Language
Instead of inserting slicers, you simply type your request. The conversation replaces the clicks.
Start with a broad request to create the initial view:
Create a pivot table summarizing the data by Year and Status, showing a count of films.

Excelmatic generates the pivot table. Now, instead of clicking slicers, you just ask follow-up questions to filter it:
Filter this to only show data for 2015.Now, just show the 'Winner' status for that year.Okay, clear the filters and show me winners for both 2016 and 2018.Create a second pivot table that counts nominees vs. winners per category, and then filter both tables to show only data for 2017.
This last prompt accomplishes in one sentence what would require creating two pivot tables, inserting a slicer, and manually configuring "Report Connections" in traditional Excel.
3. See the Results and Iterate Instantly
Excelmatic doesn't just filter the data; it presents it back to you in a clear table or pivot table format. You can immediately see the result and continue the conversation to refine your analysis.
Want a chart? Just ask.
Create a bar chart for this data.Now change it to a stacked column chart.
This conversational iteration is impossible with static slicers. You can explore hunches and answer complex, multi-step questions in seconds.
4. Export Your Finished Report
Once you have the exact view you need, you can download the result—whether it's a filtered table, a pivot table, or a chart—as a new, clean Excel file. You can also copy the formulas or pivot table configurations Excelmatic generated and paste them into your own workbook.
Example Conversation in Excelmatic
Here’s how a typical analysis workflow might look in a chat interface:
User: I've uploaded my film awards data. Can you create a pivot table showing the count of films by year and status (winner/nominee)?
Excelmatic: Done. I've created a pivot table with 'Year' as rows, 'Status' as columns, and a count of films as the values. Would you like to filter or visualize this?
User: Yes, please show me only the data for 2015 and 2016. And can you create a bar chart to visualize this?
Excelmatic: Okay, I've filtered the pivot table for 2015 and 2016 and generated a stacked bar chart to show the comparison of winners and nominees for those years. You can view the chart now or download the updated Excel file.
Traditional Slicers vs. Excelmatic: A Quick Comparison
| Feature | Traditional Slicers | Excelmatic (Excel AI) |
|---|---|---|
| How to Filter | Manually click buttons on-screen. | Type a sentence describing the desired filter. |
| Setup Process | Insert, position, and style each slicer object. | Upload a file and start asking questions. |
| Flexibility | Limited to pre-defined fields in the data source. | Handles complex, multi-part, and ad-hoc questions. |
| Dashboard Space | Slicers take up significant visual real estate. | A clean, uncluttered chat interface. |
| Learning Curve | Requires learning slicer settings, styles, & connections. | If you can describe your business need, you can use it. |
FAQ
Q: Do I need to know how to create pivot tables to use Excelmatic?
A: Not at all. You can simply ask Excelmatic to "create a pivot table to summarize sales by region," and it will build it for you. You don't need any prior knowledge of pivot table fields or settings.
Q: Is my company's data secure when I upload it to Excelmatic?
A: Yes. Excelmatic is built with enterprise-grade security. Data is encrypted in transit and at rest, and is not used for training models. For specific compliance details, always refer to the official privacy policy.
Q: Can Excelmatic connect to multiple pivot tables like slicers can?
A: It does something even better. Instead of manually linking objects, you can simply state your goal, like "filter my sales and inventory reports to show only Q1 data." The AI understands the context and applies the filter across your analysis, generating the unified result you need.
QAn what if my question is complex, like "show me winners from the last 3 years in categories that start with 'Best Actor'"?
A: This is where Excel AI shines. A query like this is extremely difficult to execute with standard slicers but is a simple instruction for Excelmatic. It can parse the complex logic and deliver the precise answer in seconds.
Q: Can I get the filtered report back into my own Excel spreadsheet?
A: Absolutely. You can download any table, pivot table, chart, or report generated by Excelmatic as a standard .xlsx file to continue your work offline or share with colleagues.
Take Action: Upgrade Your Excel Workflow Today
Every minute you spend clicking, resizing, and managing slicers is a minute you're not spending on actual analysis. The manual, click-based approach to data filtering is slow, error-prone, and struggles to keep up with the speed of business questions.
By embracing an Excel AI agent like Excelmatic, you shift from being an operator to being an analyst. You can ask deeper questions, explore data more freely, and deliver insights faster than ever before.
Stop wrestling with your reports. Start a conversation with your data.
Try Excelmatic for free and upload the very spreadsheet you're using slicers on right now. Ask it the questions you've been answering manually and see the difference for yourself.


