Every sales manager knows how vital it is to keep an eye on the funnel. But if you're still wrangling that beast with traditional Excel—color-coded rows, half-working pivot tables, and manually updated status columns—you’re spending more time fixing formulas than finding insights.
Let’s say you want to know something simple, like:
Which reps have the most leads stuck in ‘Negotiation’ for over 3 weeks?
With native Excel, that’s not a quick ask—it’s a half-hour project. You’d have to:
- Filter or conditionally format based on Funnel Stage
- Calculate “days since last update” using today’s date
- Manually combine those two conditions with a formula (likely involving
IF,DATEDIF, and maybeFILTER) - Double-check for errors in your date entries, because one wrong cell throws it all off
And heaven help you if someone copied data from a CSV where dates are in US format and others in EU.
The Messy Truth of Traditional Funnel Tracking
Let’s walk through how you’d tackle this problem the “old-school” way:
Scenario: You want to evaluate deal velocity—how fast opportunities move from “Qualified” to “Closed Won”—and identify bottlenecks.
Here’s the step-by-step reality in Excel:
- Sort entries by funnel stage (likely using a filter).
- Manually calculate time differences between
Date CreatedandLast Updatedto estimate cycle time. - Create a new column with
=DATEDIF([@Date Created],[@Last Updated],"D")to get days in stage. - Copy-paste results into a new sheet to isolate deals in “Proposal Sent” or “Negotiation”.
- Build a chart manually, or try using a PivotTable to group stages and average time.
- And if you want to compare across reps? Buckle up—you’ll need to layer in another dimension and possibly restructure the data.
Each step opens the door to errors: wrong cell references, missing dates, and inconsistent formats. Plus, it’s tedious.
What If You Could Just Ask? Enter Excelmatic.
Now imagine skipping all that. Instead of building a formula jungle, you open Excelmatic, upload your funnel log, and type:
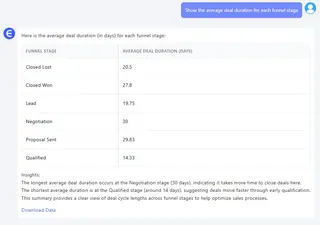
“Show the average deal duration for each funnel stage.”

“List clients stuck in the same stage for over 20 days.”
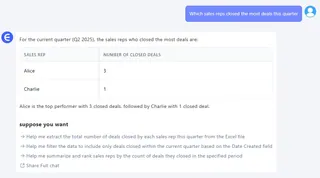
“Which sales reps closed the most deals this quarter?”

Within seconds, Excelmatic gives you clear tables, summary charts, and even natural-language insights. No formulas. No filters. No broken pivot tables.
This is what smart Excel AI looks like: powerful, fast, and human-friendly.
Side-by-Side: Excel vs. Excelmatic
| Feature | Traditional Excel | Excelmatic |
|---|---|---|
| Data Cleaning | Manual or Power Query (high learning curve) | One-click standardization |
| Time-Based Filters | Complex DATEDIF + conditional logic |
Just ask in plain English |
| Conversion Metrics | Manual formula setups + charting | Ready-made summary in 1 second |
| New Requests | Build new logic manually | Just rephrase your question |
| Risk of Errors | High | Minimal |
You Deserve Better Than Spreadsheet Chaos
If your sales team’s performance depends on a well-oiled funnel—and it does—you can’t afford bottlenecks in your data flow. You need answers fast, in language you use every day.
Excelmatic doesn’t just speed things up. It changes how you think about your data.
Whether you're running weekly sales reviews, planning quarterly forecasts, or coaching reps—your time is better spent on strategy, not spreadsheets.
👉 Try Excelmatic now and ask your own questions


