Tracking and analyzing employee expenses is a necessary part of every finance team’s workflow. But let’s be honest—it’s rarely smooth.
Between messy receipts, inconsistent categories, duplicate claims, and delays in approval, your nice-and-clean Excel file turns into a spaghetti of rows, filters, and half-written formulas.
This post dives deep into how messy this gets using traditional Excel, and how Excel AI tools like Excelmatic change the game with just a single sentence.
Traditional Excel Workflow: Tedious, Error-Prone, and Painfully Manual
Imagine your finance team collects expense reports from 30+ employees across 5 departments.
Here’s what analyzing that data typically looks like in Excel:
1. Detecting Reimbursement Errors
You need to check if anyone got reimbursed more than they claimed, or if any “Rejected” entries somehow have non-zero reimbursements.
How you’d do it:
- Add a formula:
=IF(AND([Status]="Rejected", [Reimbursed]>0), "Error", "") - Drag that down 100+ rows.
- Add conditional formatting to highlight them.
- Manually filter for non-blanks in the “Error” column.
One misplaced bracket and everything breaks.
2. Calculating Department-Level Totals
You want to summarize total expense claims vs. actual reimbursements by department.
How you’d do it:
- Create a pivot table.
- Use “Department” as rows.
- Sum “Amount” and “Reimbursed Amount.”
- Then write a separate calculated column to find the difference.
- Copy that out for presentation use.
Oh, and don’t forget to update all this when new data comes in next week.
3. Spotting Expense Category Trends
Now your CFO wants to know which expense category is eating up the most budget this quarter.
You’ll:
- Filter by date.
- Create a new pivot with “Category” and “Amount.”
- Export to a chart.
- Format axes. Adjust labels. Curse Excel's chart defaults.
This simple question becomes a 20-minute exercise—assuming your data’s clean.
Excelmatic to the Rescue: One Sentence, Instant Insights
Now, let’s switch tools. Instead of manually wrestling with formulas, I load the exact same file into Excelmatic and ask:
Question 1:
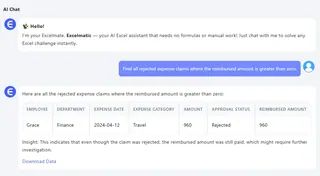
Find all rejected expense claims where the reimbursed amount is greater than zero.

Excelmatic immediately flagged 1 record: Grace from Finance was reimbursed $960 even though the expense was officially rejected. Normally this would be buried in hundreds of rows, but one sentence surfaces the issue instantly. No formulas. No VLOOKUP. No human error.
Question 2:
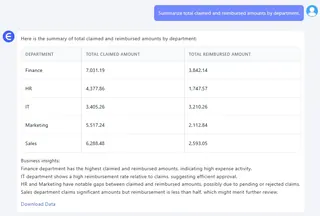
Summarize total claimed and reimbursed amounts by department.

Within seconds, you get a department-level summary with both metrics side by side—no pivot table, no SUMIFs.
Question 3:
Show a chart ranking expense categories by total claimed amount.
Excelmatic instantly generates a Bar Chart showing each expense category’s total claim amount. You can spot which categories dominate spending—like Travel and Software—and quickly decide where policy reviews might be needed.
Traditional vs. Excelmatic
| Task | Traditional Excel | Excelmatic |
|---|---|---|
| Error checking in reimbursements | Long formulas + filters + manual checks | One question, flagged rows instantly |
| Department summary | Pivot table + manual updates | Clean summary in seconds |
| Expense trend analysis | Complex pivot + custom chart formatting | Auto-chart with labeled highlights |
| Data refresh | Manual rework after every new report | Upload and ask again |
Final Thought
You don’t need to replace Excel. But you can definitely stop suffering in it.
With Excelmatic, I spend less time on repetitive reporting and more time spotting insights. Whether you're fixing faulty reimbursements or optimizing department spending, asking the right question gets you the right answer—fast.
Let Excel do the work. You focus on the finance.
👉 Try Excelmatic now and ask your own questions


