If you’ve ever had to manage a spreadsheet full of client follow-up notes, statuses, and reminders, you know it’s both essential and exhausting. Tracking customer interactions is the heartbeat of sales success, yet most teams still rely on manually updated Excel logs that feel more like detective work than analysis.
Let’s explore why the traditional way of analyzing follow-up data is so frustrating—and how Excelmatic makes it easier to uncover insights, spot risks, and prioritize outreach.
The Traditional Way: Manual Filters, Pivot Tables, and Friction
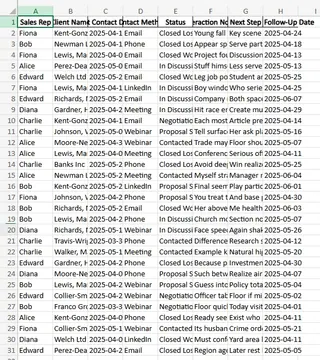
Imagine you're working with a log of 30 client entries. Each row includes fields like Sales Rep, Client Name, Last Contact Date, Contact Method, Status, Interaction Notes, and Next Follow-Up Date.

Now say your manager asks:
- "Which clients haven’t been contacted in the past 2 weeks?"
- "Who’s stuck in 'Proposal Sent' or 'Negotiation' for over 10 days?"
- "Can you show me all next steps planned for this week by rep?"
Here's what you'd typically do in Excel:
- Manually add a new column to calculate contact gaps using formulas like
=TODAY()-[Last Contact Date] - Apply filters to identify overdue accounts
- Use COUNTIFS and IF statements to break down reps' workloads by stage
- Add conditional formatting to highlight risk zones
- Cross-reference upcoming follow-up dates with the calendar week
- Possibly export filtered lists to build charts or summaries for meetings
It works—but it’s slow, formula-heavy, and highly error-prone. Not to mention, every change in the spreadsheet layout requires adjusting all your formulas again.
The Excelmatic Way: Ask and Answer
Instead of creating columns, dragging filters, or second-guessing COUNTIFS, Excelmatic gives you the same insights in seconds. Here are three questions you might ask it:
1. List all clients with no follow-up in the past 14 days.
Excelmatic checks the date gap and returns a list, sorted by urgency.
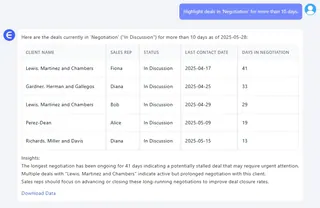
2. Highlight deals in ‘Negotiation’ for more than 10 days.
It analyzes the Last Contact Date + Status and flags records for attention.

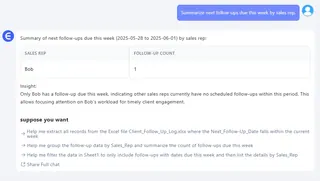
3. Summarize next follow-ups due this week by sales rep.
You get a clear breakdown showing who needs to reach out when.

No formulas. No formatting. Just fast, actionable answers you can act on—or share directly with your team.
Why This Matters: Follow-Ups Drive Revenue
Sales is about timing. If your reps miss a follow-up by three days, it can cost a deal. If you don’t know which stage clients are stuck in, your pipeline leaks opportunity.
But when your tracking is locked behind Excel logic and filters, insights arrive too late. Excelmatic shifts that. With it, you can:
- Instantly spot dormant leads
- Prioritize reps by follow-up urgency
- Find process bottlenecks in your customer journey
Comparison Table
| Task | Traditional Excel | Excelmatic |
|---|---|---|
| Find overdue follow-ups | Date math + filters | Natural language request |
| Identify stalled deals | Manual status check + date formulas | AI-driven filter and flagging |
| View this week’s action list | Sort by date and group manually | One question returns grouped list |
| Share data with leadership | Clean + export filtered tables | Clean summary already provided |
Final Thoughts: Don’t Let Spreadsheets Delay Deals
You shouldn’t have to be a spreadsheet engineer to know which clients need attention. With Excelmatic, you spend less time updating, filtering, or validating formulas—and more time following up, closing, and growing revenue.
So the next time someone asks, “Who needs a call this week?” — don’t scroll through rows. Just upload your log, ask the question, and let Excelmatic give you the answer.
Upload the file. Ask what you want.And finally, get back to making actual decisions.


