You launched your brand. You’ve got competition. But do you know who’s winning the monthly sales race?
You will—once you visualize it with a multi-line chart. Let Excelmatic show you the clearest showdown of your e-commerce life
Traditional Way: Manual, Messy & Moody
Trying to chart three brands’ monthly sales? That’s a pain:
- Aggregate data by brand + month
- Align on same timeline axis (trickier than it sounds)
- Insert multi-line chart, assign colors, adjust labels
- Realize you forgot a brand or mismatched a date
It’s like trying to make a TikTok duet manually. Way harder than it looks.
Excelmatic Makes It Easy
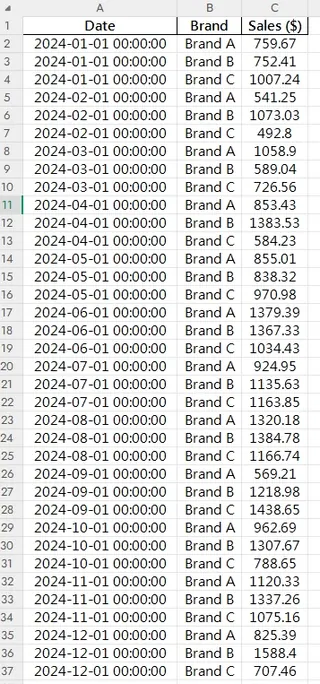
Let's say you have the following data:

Just say:
Prompt: Show a multi-line chart of monthly sales for Brand A, Brand B, and Brand C in 2024.
Excelmatic will:
- Group each brand by month
- Assign clear, color-coded lines
- Plot everything on a time axis with aligned intervals
- Even make it beautiful and readable
When to Use Multi-Line Charts
- Compare performance over time across groups
- Identify seasonal patterns or growth gaps
- Great for competitive tracking and internal benchmarking
Manual vs Excelmatic AI
| Task | Traditional Excel | Excelmatic AI |
|---|---|---|
| Group by brand/month | Pivot or formulas | Instant |
| Time alignment | Manual effort | Auto-synced |
| Chart customization | Many clicks | One-prompt perfect |
| Legend, colors | Tedious | Auto-matched |
| Insight quality | Moderate | Crystal clear |
| Time to result | 20–40 mins | < 1 minute |
Pro Tips
- Keep line colors high-contrast (Excelmatic does this for you)
- Add data labels or trendlines for top performers
- Use interactive filters if comparing more than 3 lines
Wrap-Up
Whether you’re chasing your competitors or tracking your own product lines, a multi-line chart tells a complete story—without the manual grind.
With Excelmatic, all it takes is a smart question. Then just follow the lines.


