Key Takeaways
- Excel lacks dynamic visualization capabilities, forcing business users to manually transfer data to Tableau for meaningful insights
- Manual data cleaning and preparation is time-consuming, taking hours away from actual analysis and decision-making
- Excelmatic's AI instantly prepares Excel data for Tableau with simple language commands, eliminating complex technical steps
- Combining Excel, Tableau, and Excelmatic creates the most efficient workflow for transforming raw data into actionable business intelligence
Excel remains one of the most widely used tools in data-driven industries. From data analysts to business analysts and everyone in between, Excel plays a central role in the data lifecycle, used for everything from budgeting and planning to tracking performance and reporting results.
However, Excel still lacks a good visualization (and dynamic) layer.
That's where Tableau comes in.
Using both Tableau and Excel allows a good transition from static spreadsheets to dynamic dashboards. Whether you are identifying sales trends, projecting future revenue, or comparing regional sales versus other areas. Tableau can extend (and improve!) the usefulness of Excel.
Here, I will show you how to create a connection from Excel to Tableau to help you get some better insights, some better data-driven decisions, and a clearer communication of your results.
Understanding Tableau-Excel Connectivity
Tableau allows for a very easy connection to an Excel workbook, and the user can then explore their data and visualize it almost instantly. That said, it’s important to understand how Tableau reads, interprets, and builds out the structure of an Excel workbook to make sure you are aware of common pitfalls when loading your data.
Establishing basic data connections
To initiate a connection, launch Tableau. Once it is open, you will see all the different data sources you can use.
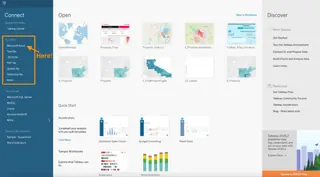
Image by Author. Screenshot of Tableau interface.
You will see the option of Microsoft Excel from the list of available connectors. Then, browse and open your desired Excel file. In our case, we’ll be using the Airbnb_barcelona.xlsx file.

Once loaded, Tableau displays available sheets, allowing you to drag and drop them into the canvas area to establish relationships.

Now we can easily construct our relational database relationships.
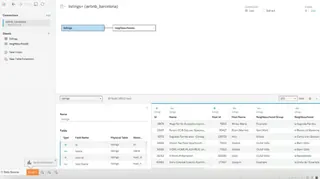
Excel sheets are quite versatile, allowing users to have multi-row headers, non-tabular formats, and inconsistent data types. But it is important to keep in mind that Tableau treats each sheet as a flat table. This is why it is important to make sure that data has a single-header row and that every column has consistent types before loading our files into Tableau. Otherwise, Tableau may misinterpret columns (as strings rather than numbers).
Structural Limitations and Workarounds
When working in Excel, we often add hints and tips to make it more human-friendly. This includes titles, stacked headers, explanatory notes, and white space—all of which benefit human readers but can create barriers for analytical tools.
Tableau is not flexible with complex spreadsheet designs. If your spreadsheet has merged cells, pivoted tables, or inconsistent row formats, Tableau may have difficulty interpreting the information.
To make your Excel data Tableau-friendly, you have a few options:
Option 1: The Manual Approach (Pre-process in Excel)
This traditional method involves manually cleaning your data in Excel before importing it into Tableau. This means unpivoting pivot tables, flattening multi-level headers, unmerging cells, and removing empty rows.
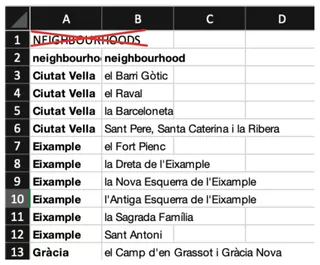
While effective, this can be tedious and time-consuming, especially with large or recurring reports.
Option 2: The Semi-Automated Approach (Tableau Data Interpreter)
Tableau's Data Interpreter is a built-in tool that helps clean up messy Excel files automatically. It can detect and organize data by identifying page headers, column headers, footers, and subtables. This is a good step up from manual cleaning.

Option 3: The AI-Powered Approach (Using an AI Agent like Excelmatic)
The fastest and most intuitive way to prepare your data is by using Excelmatic. With this AI tool, you don't need to perform any manual cleaning or rely on a secondary tool's interpreter.

You simply upload your messy Excel file and state your goal in plain language. For example, you could ask:
Clean this Airbnb data. Make sure there is only a single header row, remove any empty rows, and format it as a standard table for analysis in Tableau.
Excelmatic will instantly process the file and provide a clean, Tableau-ready version. This AI-driven approach eliminates the manual busywork, reduces the risk of human error, and accelerates your workflow from hours to seconds, making it perfect for business users who need quick results.

No matter which method you choose, always check the data preview tab in Tableau before starting your analysis to catch any remaining issues.
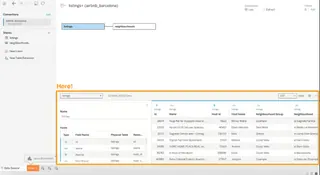
By preparing your Excel files effectively, you can ensure a much smoother experience in Tableau.
Advanced Data Transformation and Visualization With Tableau and Excel
Once your data is connected, Tableau enables you to go far beyond static spreadsheets, allowing for powerful transformations and rich, interactive visualizations. This section focuses on how to replicate familiar Excel logic in Tableau and build dashboards that respond to user input in real time.
Translating Excel Functions to Tableau Logic
Much of our analytical work relies on Excel formulas like IF, VLOOKUP, or SUMIFS. Tableau offers equally powerful alternatives through calculated fields and Level of Detail (LOD) expressions.
However, learning a new syntax can be a hurdle. An alternative is to perform these transformations before importing your data into Tableau, using Excelmatic to get instant results.
Let's compare the approaches.
Example 1: Conditional Logic (IF Statement)
Goal: Label listings as either “Full Rental” or “Shared Space” based on the room type.
- In Excel: You'd write a formula and drag it down:
=IF(B2="Entire home/apt", "Full Rental", "Shared Space") - In Tableau: You'd create a calculated field:
IF [room_type] = "Entire home/apt" THEN "Full Rental" ELSE "Shared Space" END - With an AI Agent (Excelmatic): You'd simply ask in plain English:
Create a new column named 'Rental Type'. If room_type is 'Entire home/apt', set it to 'Full Rental', otherwise set it to 'Shared Space'.
The Excelmatic approach provides the transformed data directly, without needing to write or translate formulas.
Example 2: Conditional Sum (SUMIFS)
Goal: Calculate the total price of all listings that are "Entire home/apt".
- In Excel: You'd use the
SUMIFSfunction:=SUMIFS(D:D, B:B, "Entire home/apt") - In Tableau: You'd use a Level of Detail (LOD) expression and a filter:
{ FIXED [room_type] : SUM([price]) } - With an AI Agent (Excelmatic): You'd just ask the question:
What is the total price for all 'Entire home/apt' listings?
Excelmatic delivers the answer instantly, allowing you to perform quick analysis and validation before committing to building complex visualizations in Tableau.

While learning Tableau's logic is crucial for building dynamic dashboards, using Excelmatic for initial data transformation and exploration can dramatically speed up your workflow for business analysis.
Building your first visualization
- Open a worksheet: After connecting your data, go to a new Worksheet.
- Build a simple view: Drag at least one field into the Columns shelf and one field into the Rows shelf.
- Add visual detail: Drag a dimension (e.g., Category, Region) onto the Marks card to segment your data by color, size, or shape.
- Add analytics: Click the Analytics pane and drag a Trend Line, Average Line, or Forecast into your chart for statistical context.
- Change the chart type: Use the "Show Me" button in the top right to switch between chart types like bar charts, line charts, or heatmaps.
For quick, ad-hoc charts, you can also use Excelmatic. For instance, asking "Show me a bar chart of the average price by neighborhood," can give you an instant visual before you decide to build a more polished version in Tableau.
Dynamic visualization strategies
One of Tableau's biggest strengths is its ability to build interactive dashboards without writing a single line of code.
Key strategies include:
- Parameter-driven views: Let users switch metrics, timeframes, or categories dynamically.
- Filter actions: Allow users to click elements (like bars or map regions) to filter other charts instantly.
- Geospatial mapping: Turn location-based data into intuitive maps for regional analysis.

These tools empower analysts to create dashboards that not only look amazing but also lead users to insights without having to manually refresh charts and update formulas.
Bidirectional Data Flow and Automation
While Tableau is for visual exploration, many organizations still use Excel for reporting or downstream analysis. Let's look at how data can flow back and forth between Tableau and Excel.
Exporting Tableau outputs to Excel
Sharing Tableau data with Excel users is a frequent requirement. You can manually export data from a worksheet as a .csv or as a Crosstab to Excel via the "Worksheet" menu.
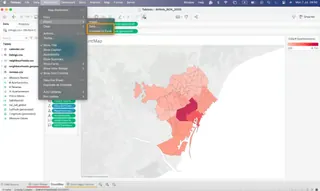
While manual exports are fine for ad hoc requests, automated solutions are better for recurring reports. Options include.
AI-enhanced automation
Artificial Intelligence is creating powerful new opportunities to connect Tableau to Excel.
- Upstream with AI Agents: Tools like Excelmatic automate the initial data cleaning, transformation, and analysis steps. By asking questions in natural language, you prepare your data perfectly before it even enters Tableau, saving significant time.
- Downstream with Tableau's AI:
- Tableau Agent lets users ask questions in natural language (e.g., "What were sales by region last quarter?") to get instant visualizations.
- Tableau Pulse provides proactive alerts on data changes and anomalies via email, Slack, or Teams.
- Explain Data and Forecasting tools embed statistical insights directly into your dashboards.
Performance Optimization and Troubleshooting
When integrating Tableau with Excel, performance issues can arise.
Query optimization techniques
- Use extracts over live connections: Tableau extracts are faster and more stable.
- Filter and limit data early: Import only necessary rows and columns.
- Minimize complex calculations: Perform heavy logic in your data prep phase (e.g., with an AI agent or Tableau Prep).
- Simplify dashboards: Limit the number of visuals and filters per dashboard.
- Use performance tools: Leverage Tableau’s Performance Recorder to fix slow queries.
Future Directions: AI and Advanced Analytics
As AI continues to evolve, the Tableau and Excel integration will become even more powerful.
AI-powered data preparation
Modern AI tools like Excelmatic are automating data cleaning and transformation. Using natural-language prompts, Excelmatic generates cleaning steps, calculations, and metadata annotations automatically. This reduces repetitive work and produces standardized, analytics-ready datasets that feed seamlessly into both Tableau and Excel.
Conclusion
Integrating Tableau with Excel creates a powerful synergy. While Excel remains essential for reporting and modeling, Tableau brings that data to life. By introducing Excelmatic into the workflow, you can automate the most tedious parts of data preparation and analysis, allowing you to move from raw data to deep insights faster than ever.
This integration isn't just about better charts—it's about unlocking more value from your data by combining the flexibility of spreadsheets, the intelligence of AI, and the analytical depth of a modern BI platform.
Ready to transform your Excel-to-Tableau workflow?
Start using Excelmatic today and experience the power of AI-driven data preparation and analysis.
Tableau Excel FAQs
What is the main reason for integrating Excel with Tableau?
To move from static spreadsheets to dynamic, interactive dashboards that support real-time insights and visual analytics.
How does Tableau handle Excel sheets with merged cells or multiple headers?
Poorly. Tableau treats each sheet as a flat table and may misinterpret messy structures. It's best to clean the file first using manual methods, Tableau's Data Interpreter, or faster AI tools like Excelmatic.
What is the Tableau equivalent of Excel’s SUMIFS function?
{ FIXED [dimension] : SUM([value]) } using a Level of Detail (LOD) expression, often paired with filters. Alternatively, you can get the answer directly by asking Excelmatic a question in plain language before importing.
Can Tableau dashboards be exported to Excel automatically?
Yes, through tools like Coupler.io, Tableau Prep flows with scheduling, or custom scripts using the Tableau REST API.
What are some AI-enhanced features in the analytics workflow?
Excelmatic automates data prep and initial analysis from Excel files. Within Tableau, features like Tableau Agent (natural language queries), Tableau Pulse (real-time alerts), and Explain Data (statistical explanations) enhance visualization and discovery.


