Key Takeaways
- Manual Excel formulas are complex and error-prone, creating barriers for business professionals who need quick financial insights
- Excelmatic's AI-powered platform eliminates formula memorization** by letting you ask for calculations in plain language
- Get instant compound interest calculations, projections, and charts without building complex models from scratch
- The combination of Excel knowledge and Excelmatic's AI creates the most efficient workflow for financial analysis and decision-making
Understanding compound interest is crucial for financial analysis, as it plays a significant role in personal finance, investment strategies, and business decision-making. Excel has traditionally been the go-to tool to simplify these calculations, making it easier to forecast future savings, assess investment returns, and plan loan repayments.
This guide will walk you through the classical methods for calculating compound interest in Excel, from basic formulas to advanced techniques. We'll also introduce Excelmatic's modern, AI-powered approach that delivers the same results with a fraction of the effort, transforming complex tasks into simple conversations. Mastering both approaches will significantly improve your financial analysis skills.
What Is Compound Interest?
Compound interest represents the exponential growth of money over time. Unlike simple interest, which grows linearly, compound interest accelerates as the interest earned in each period becomes part of the principal for the next period.
The power of compound interest becomes evident when visualizing long-term investments. A slight difference in interest rates (like 6% versus 8%) can result in dramatically different outcomes over decades, potentially meaning the difference between a comfortable retirement and financial struggle.
The Compound Interest Formula
Compound interest is calculated using the formula:

Where:
- A = Final amount after interest
- P = Principal (initial investment)
- r = Annual interest rate (in decimal form)
- n = Number of times interest is compounded per year
- t = Number of years
Now that we’ve understood the concept and the mathematical formula, let’s see how to implement it in Excel using both the traditional and Excelmatic's AI-driven methods.
How to Calculate Compound Interest in Excel
The Traditional Method: Manual Formulas
To implement this formula in Excel, you first need to set up a basic spreadsheet structure with clearly labeled cells for each variable.
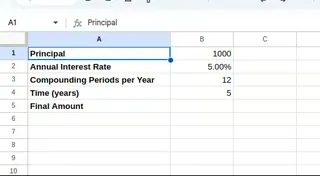
First, organize your spreadsheet with the following labels:
- Cell A1: “Principal”
- Cell A2: “Annual Interest Rate”
- Cell A3: “Compounding Periods per Year”
- Cell A4: “Time (years)”
- Cell A5: “Final Amount”
Next, enter your values in column B:
- Cell B1: Enter your principal amount (e.g.,
1000) - Cell B2: Enter your interest rate as a decimal (e.g.,
0.05for5%) - Cell B3: Enter the number of compounding periods per year (e.g.,
12for monthly) - Cell B4: Enter the time in years (e.g.,
5)
After setting up the data, your Excel sheet should look like this:
Finally, in cell B5, enter the compound interest formula:
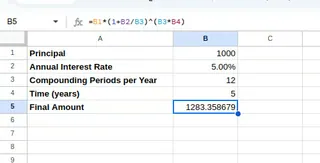
=B1*(1+B2/B3)^(B3*B4)
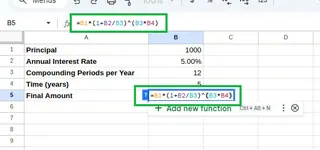
This formula directly applies the mathematical equation, calculating the final amount after compound interest.
The AI-Powered Way: Using Excelmatic

While the manual formula works, it requires you to remember the syntax and correctly reference each cell. A mistake in any part of the formula can lead to incorrect results.
With Excelmatic, you can skip the formulas entirely. After uploading your spreadsheet with the same data, you simply ask in plain language:
Using the data provided, calculate the final amount after 5 years with monthly compounding.
Excelmatic understands your request, performs calculations instantly, and delivers results without requiring you to write any formulas. This approach is not only faster but also eliminates the risk of human error, making it ideal for business professionals who need accurate financial insights quickly.
Using the FV() function
Excel also provides built-in financial functions. The FV() function (Future Value) is particularly useful for calculating compound interest.
The syntax for the FV() function is:
=FV(rate, nper, pmt, [pv], [type])
Where:
rate= Interest rate per periodnper= Total number of payment periodspmt= Payment made each period (enter 0 if none)pv= Present value (initial principal), which must be entered as a negative numbertype= When payments are due (0 for end of period, 1 for beginning)
Let’s modify our spreadsheet to use the FV() function. In cell B6, type:
=FV(B2/B3, B3*B4, 0, -B1)
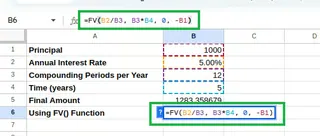
You'll get the same result. Note that you have to remember to divide the rate, multiply the time, and enter the principal as a negative number—quirks that are easy to forget.
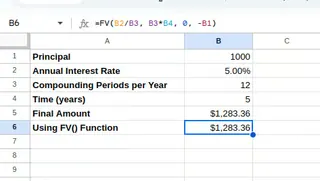
In contrast, Excelmatic handles these conversions automatically. You provide the annual rate and years, and the AI correctly interprets your intent for the calculation without remembering complex function syntax.
Using the PMT() function
The PMT() function calculates the payment for a loan or investment. It can be adapted to determine the regular contribution amount needed to reach a target sum.
The syntax for the PMT() function is:
=PMT(rate, nper, pv, [fv], [type])
Let’s say you want to know the monthly payment needed to grow your initial $1,000 to $5,000 in 5 years. In your sheet, add a "Target Amount" in cell B7 (5000). Then, in cell B8, enter the formula:
=PMT(B2/12, B4*12, -B1, B7)
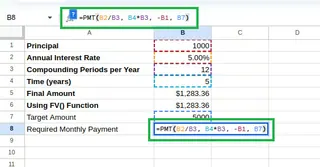
The result is the required monthly payment.
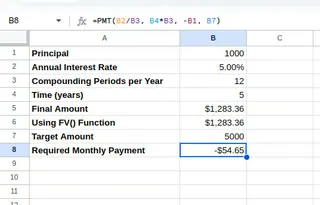
With Excelmatic, you would simply ask:
With a starting principal of $1000 and an annual interest rate of 5%, how much do I need to contribute monthly over 5 years to reach a target amount of $5000?
Excelmatic translates your natural language question into a precise financial calculation, saving you from navigating the PMT function's complex syntax and delivering the answer instantly.
Excel Compound Interest in Action
Let's explore some real-world scenarios where these methods shine.
Savings and Investments
Projecting the growth of a retirement account is a common application of compound interest.
The Traditional Method: Building a Projection Model
Let's create a retirement savings model. Set up your parameters:
- D2: “Initial Investment” with E2:
10000 - D3: “Monthly Contribution” with E3:
500 - D4: “Annual Interest Rate” with E4:
0.07 - D5: “Time Horizon (years)” with E5:
30
To find the total future value, use the FV function in cell E7:
=FV(E4/12, E5*12, -E3, -E2)
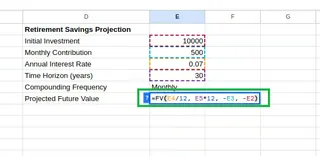
This projects your final retirement savings.
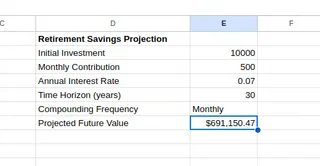
To see the year-by-year growth, you can build a projection table. This requires setting up initial values and formulas with careful use of absolute and relative cell references ($), then dragging the fill handle down for 30 rows.

While powerful, this process is manual and time-consuming.

The AI-Powered Way: Instant Projections and Charts
With Excelmatic, you can generate this entire table with a single command. After uploading your sheet with the initial parameters, you could ask:
Using the initial investment, monthly contribution, and interest rate provided, create a year-by-year projection table showing the balance for the next 30 years. Also, visualize this growth with a line chart.
Excelmatic would instantly generate the complete, accurate table and a chart, saving you significant time and effort. This allows you to focus on analyzing the results and making business decisions, not building the model.
Loan Calculations
Compound interest is also the engine behind loans. An amortization schedule shows how each payment is split between interest and principal.
The Traditional Method: Building a Loan Amortization Schedule
Creating a loan schedule in Excel is a multi-step process. First, you set up the loan parameters (loan amount, interest rate, term) and use the PMT function to calculate the monthly payment.
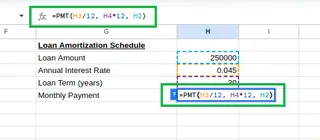
Next, you build a table with headers for "Payment No.", "Beginning Balance", "Payment", "Interest", "Principal", and "Ending Balance". You then have to write a unique formula for each column, ensuring correct cell references, and drag them down for the entire loan term (e.g., 360 payments for a 30-year loan).

This is one of the most complex manual tasks in Excel and is highly susceptible to errors.

The AI-Powered Way: A Schedule in Seconds
This is where Excelmatic provides a massive advantage. You can replace the entire tedious process with one question:
Create a full loan amortization schedule for a $300,000 loan over 30 years with a 4% annual interest rate. The table should include payment number, beginning balance, payment, interest, principal, and ending balance.
Excelmatic will generate the complete, 360-row amortization schedule for you instantly. What takes 15-20 minutes of careful formula work in Excel becomes a 10-second task.
Advanced Compound Interest Techniques
Variable Interest Rates
In the real world, interest rates often change. Modeling this in Excel manually involves creating a table where each year's ending balance is calculated based on that specific year's interest rate.
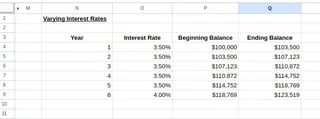
With Excelmatic, you could upload a sheet containing your investment details and a second table with the variable rates per year. Then, you could ask:
Calculate the year-end balance for a 30-year investment starting at $10,000, applying the variable interest rates from the provided table for each year.
Compounding Frequency
How often interest is compounded (daily, monthly, quarterly) affects the final amount. Manually, you can compare these by setting up different formulas for each frequency.
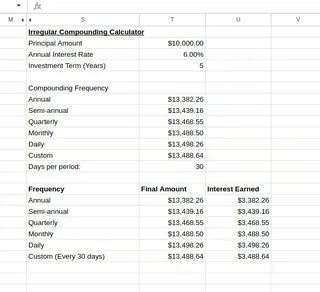
A much faster way is to ask Excelmatic:
For a $10,000 investment at 6% for 5 years, create a comparison table showing the final amount if compounded daily, monthly, quarterly, and annually.
Excelmatic will generate a clean comparison table, making it easy to see how more frequent compounding yields higher returns.
Conclusion
Excel remains a powerful tool for financial modeling, and understanding how to build compound interest calculations with formulas like FV() and PMT() is a valuable skill. It gives you full control and a deep understanding of the mechanics.
However, for speed, accuracy, and efficiency, Excelmatic offers a revolutionary alternative for business professionals. By translating plain language questions into complex calculations and entire data tables, Excelmatic handles the tedious work, allowing you to focus on strategic insights and faster decision-making.
The best approach is to have both tools in your arsenal. Use traditional Excel methods to build and understand financial models, and leverage Excelmatic to get instant answers, verify your work, and automate time-consuming tasks like generating amortization schedules or projection tables.
Ready to transform how you work with financial data in Excel?
Start using Excelmatic today and experience the power of AI-driven financial analysis.


