Key Takeaways
- Manual skewness calculations in Excel require technical knowledge of functions like
SKEW()or complex Data Analysis ToolPak setup - Excelmatic provides instant skewness analysis using plain language - no formulas or statistical expertise needed
- Understanding data skewness helps identify business insights like customer wait time patterns or sales distribution anomalies
- AI-powered analysis saves time and reduces errors for marketing, sales, and operations professionals who need quick data insights
Understanding the skewness of your data is a crucial step in any analytics project. It helps identify potential outliers or anomalies, which could indicate data quality issues or areas requiring further investigation. Skewness also provides insights into the asymmetry of the data, which impacts the choice of statistical methods and downstream models.
In this tutorial, we will cover the concept of skewness, its mathematical definitions, and the different types of skewness in data distributions. Using a simple real-world example, we will calculate skewness using traditional Microsoft Excel methods and compare them to a modern, AI-powered approach. If, at the end of this tutorial, you are looking to expand your skills further, consider exploring our Data Analysis in Excel course.
The Quick Answer: How to Calculate Skewness in Excel
To quickly calculate skewness in Excel, use either the SKEW() function for a sample or the SKEW.P() function for an entire population.
Follow these steps:
- Enter your data in a single column.
- In a new cell, type
=SKEW(range)or=SKEW.P(range), whererangeis the range of your data cells. - Press Enter to get the skewness value. Skewness is represented by a single number.
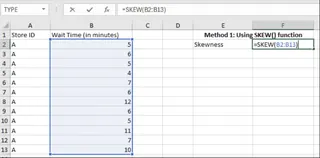
Calculating skewness using the SKEW() function. Image by Author
While this is the fastest manual method, AI-powered tools can now perform this analysis even more intuitively, simply by asking a question in plain language. We'll explore this later in the guide.
What is Skewness?
Skewness is a statistical metric that measures the asymmetry of a distribution. It indicates whether the data points tend to fall more to one side of the mean than the other.
It is considered the third moment of a distribution:
- Center (First Moment): The average of the data, providing a measure of the typical value.
- Spread (Second Moment): The variability of the data, quantifying how much data points deviate from the mean.
- Skewness (Third Moment): The asymmetry of the data distribution around its mean.
- Kurtosis (Fourth Moment): The "tailedness" or peakedness of the data distribution, providing insight into the weight of the tails.
Skewed Distributions
Depending on whether the skewness coefficient is positive, negative, or zero, there are three types of skewness.
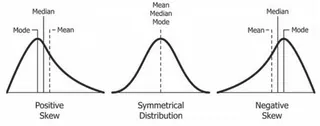
Skewed distributions. Source: Wikipedia
- Positive Skewness (Right Skewness): The tail on the right side of the distribution is longer than the left. Most data points are concentrated on the left. The mean is typically greater than the median.
- Zero Skewness (Symmetrical Distribution): The distribution is perfectly symmetrical. The tails on both sides are balanced, and the mean and median are equal.
- Negative Skewness (Left Skewness): The tail on the left side of the distribution is longer than the right. Data points are concentrated on the right. The mean is typically less than the median.
While skewness focuses on the spread (tails) of the distribution, another statistical metric, kurtosis, focuses more on the height and peakedness. With AI tools like Excelmatic, you can easily calculate both skewness and kurtosis in a single query, getting a complete picture of your data distribution without needing to learn multiple statistical functions.
Now that we've understood the concept, let's calculate it for sample data using Excel.
Methods to Calculate Skewness in Excel
Imagine you’re a data analyst tasked to analyze customer wait times at a popular retail chain. Management suspects long wait times might be contributing to varied customer satisfaction levels. To investigate, they have sampled data on customer wait times from a store over a few days.
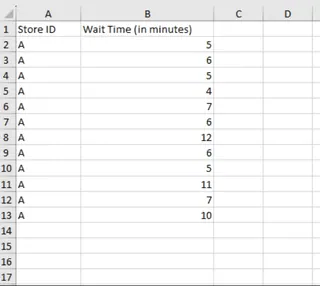
Customer wait time dataset. Image by Author
Here are three methods you could use to calculate the skewness metric for this data.
Method 1: Using the SKEW() Function
The most direct way to calculate sample skewness is with Excel's built-in SKEW() function.
The syntax is simple:
SKEW(number1, [number2], ...)
You can include up to 255 arguments, which can be single numbers or a range of cells.
For our data, we would enter the following formula in a cell, say F2:
=SKEW(B2:B13)
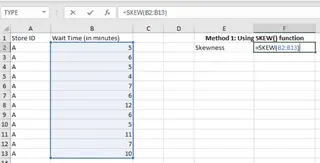
Calculating the skewness using the SKEW() function. Image by Author
Pressing Enter gives us the skewness coefficient.
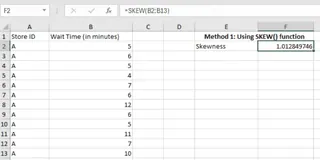 Skewness result. Image by Author
The positive output indicates that the wait times are right-skewed. Before we interpret this, let’s explore another method.
Method 2: Using the Data Analysis ToolPak
For a more comprehensive statistical summary, you can use the Data Analysis Toolpak, an Excel add-in.
If you don't have it enabled, you'll need to set it up first. Go to File > Options > Add-ins. In the Manage box, select Excel Add-ins and click Go. Check the Analysis ToolPak box and click OK.
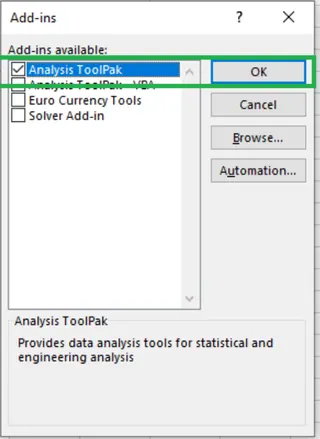 Enabling Data Analysis ToolPak. Image by Author
Once enabled, the Data Analysis icon will appear under the Data tab.
Click the Data Analysis icon on the Data tab.
Select Descriptive Statistics from the list and click OK.
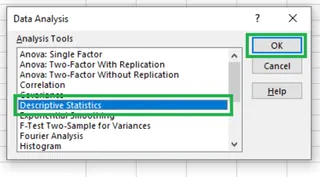 Selecting descriptive statistics. Image by Author
In the dialog box:
- Set the Input Range to your data (
$B$1:$B$13). - Check Labels in first row since our selection includes the header.
- Choose an Output Range (e.g., cell
$E$5). - Check Summary statistics.
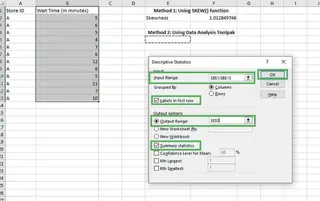 Filling in details for descriptive statistics. Image by Author
- Set the Input Range to your data (
Click OK. Excel will generate a full table of descriptive statistics, including skewness.
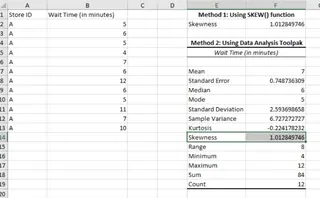 Descriptive statistics results. Image by Author
This method is powerful because it provides skewness alongside other key metrics like mean, median, mode, and standard deviation in one go.
Method 3: The AI-Powered Way with Excelmatic

For business professionals who need quick insights without technical hurdles, AI tools like Excelmatic offer a revolutionary approach. Excelmatic is an AI Excel Agent that delivers instant answers and insights from your data without needing to remember formulas or navigate menus.
Instead of formulas or multi-step setups, you just ask for what you need in plain language.
Here’s how you would calculate skewness with Excelmatic:
- Upload your file: Securely upload your Excel sheet containing the customer wait times.

Ask your question: In the chat interface, simply type your request, such as:
"Calculate the skewness for the 'Wait Time (minutes)' column."
Or, for a broader analysis:
"Give me a descriptive statistics summary for the customer wait times."

- Get instant results: Excelmatic processes your request and instantly provides the skewness value, along with other relevant statistics, just like the Data Analysis ToolPak but without any of the setup. It might also offer to visualize the distribution for you.
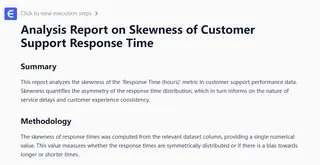
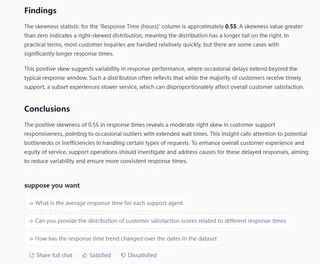
This approach completely bypasses the need to enable add-ins or memorize function syntax, making complex analysis accessible to everyone.
Comparing the Methods
| Feature | SKEW() Function | Data Analysis ToolPak | Excelmatic (AI Agent) |
|---|---|---|---|
| Ease of Use | Easy, if you know the function. | Moderate, requires one-time setup and menu navigation. | Very Easy, uses natural language. |
| Speed | Fast for a single calculation. | Slower due to multiple steps. | Instantaneous. |
| Required Knowledge | Knowledge of Excel functions (SKEW). |
Knowledge of Excel add-ins and statistical terms. | No specific Excel knowledge needed. |
| Scope of Analysis | Calculates only skewness. | Provides a full summary of descriptive statistics. | Provides full summary + charts + insights. |
Interpreting the Skewness Results
Using all three methods, we get the same skewness value of 1.0128 for the customer wait times. Here's what that tells us:
- Right-Skewed Distribution: The positive value indicates a right-skewed (positively skewed) distribution. This means that while most waits are short, there are outliers with unusually high wait times.
- Mean versus Median: The mean wait time (5.83 mins) is higher than the median (5.5 mins). This confirms that a few significantly longer wait times are pulling the average up. The median is likely a better measure of the typical customer experience.
- Business Insights: The mode is 5 minutes, the most common wait time. However, the right skewness highlights inconsistency. Management should focus on understanding and reducing the causes of these long-wait outliers to improve overall customer satisfaction.
If the skewness were negative, it would indicate a left-skewed distribution, suggesting most customers experience longer waits, with a few outliers having exceptionally short waits.
A Deep Dive Into What the Excel Skewness Functions Are Doing
Excel's skewness functions calculate momental skewness, the third standardized moment. It quantifies asymmetry by comparing the cubed deviations from the mean to the cubed standard deviation.
For a sample of data, the formula used is:

Momental skewness equation. Image by Author
Where:
- n is the number of data points.
- Xi is each individual data point.
- xˉ is the mean of the data points.
- s is the sample standard deviation.
The SKEW() function uses this formula, which includes a correction factor (n / ((n-1)*(n-2))) to provide an unbiased estimate for a sample. The SKEW.P() function calculates skewness for an entire population and uses a simpler formula without this correction.
Further Reading: Other Kinds of Skewness
While momental skewness is most common, other measures exist:
- Pearson’s Skewness Coefficients: Use the mean, mode, and median. The second coefficient (using the median) is more robust to outliers.
- Kelly’s Measure of Skewness: Based on percentiles (P10, P50, P90), focusing on the tails of the distribution.
- Bowley’s Measure of Skewness: Based on quartiles (Q1, Q2, Q3), making it highly resistant to extreme values.
 Bowley’s skewness equation. Image by Author
Final Thoughts
This tutorial introduced you to the concept of skewness and demonstrated how to calculate it in Excel. We covered the traditional SKEW() function and the comprehensive Data Analysis ToolPak. We also explored how modern AI tools like Excelmatic are revolutionizing this process, allowing you to get the same, if not better, insights by simply asking a question.
Your learning doesn't have to stop here. Excelmatic provides comprehensive resources to enhance your data skills without the technical complexity: our simplified statistics tutorials break down concepts like skewness into practical business applications, our Excel basics guides help you master essential data operations through intuitive examples, and our formula-free workflow tutorials show you how to achieve faster results using plain language commands instead of memorizing functions.
Ready to simplify your data analysis workflow?
Try Excelmatic today and get instant skewness calculations and business insights using simple language commands - no formulas or statistical expertise required.
FAQ
What is the difference between the SKEW() and SKEW.P() functions in Excel?
The SKEW() function calculates skewness for a sample of a population and includes a correction for sample size. The SKEW.P() function calculates skewness for an entire population without this adjustment.
Can skewness be used to identify outliers in my data?
Yes, skewness can help identify potential outliers. A value far from zero indicates a long tail on one side of the distribution, which is where outliers are often found.
How do I interpret the skewness value calculated in Excel?
A value near zero suggests a symmetric distribution. A positive value indicates a right-skewed distribution (tail on the right). A negative value indicates a left-skewed distribution (tail on the left).
Why does Excel give me a #VALUE! error when I calculate skewness?
A #VALUE! error occurs if the range for the skewness function includes non-numeric data like text. Ensure all cells in the range contain only numbers.
Why does Excel give me a #DIV/0! error when I try to calculate skewness?
A #DIV/0! error occurs if there are fewer than three data points in your dataset or if the standard deviation is zero (all values are the same). You need at least three varied data points.


