When you're in sales ops or payroll, calculating bonuses and commissions sounds straightforward—until you try doing it manually in Excel. One error in a formula, one misaligned row, and suddenly someone's paycheck is off or HR is in your inbox. If you’re trying to manage incentive compensation across teams, territories, and performance tiers, you already know it’s messy work.
Let’s walk through why traditional spreadsheet methods are painful, and how AI-powered tools like Excelmatic can streamline the entire process with one smart question.
The Traditional Way: Sums, IFs, and Stress
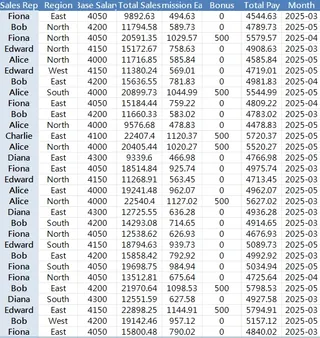
Say you’ve got a worksheet of sales reps with their base salary, monthly sales, and a fixed 5% commission rate. Anyone selling over $20,000 gets a $500 bonus. Sounds easy, right?

Here's what you'd typically do:
- Add a formula for commission:
=TotalSales * 5% - Use
IF()to apply the bonus:=IF(TotalSales > 20000, 500, 0) - Calculate total pay: base + commission + bonus
- Apply rounding for currency values
- Add conditional formatting to flag high performers
- Sort by region, month, or rep for reporting
- Create charts to visualize top earners or trends
Multiply that by 30 reps per month, across regions and sales cycles—and now you’re debugging nested formulas while someone asks for a year-to-date breakdown.
Even for experienced Excel users, it's time-consuming. For everyone else, it's chaos.
The Excelmatic Way: Ask, Don’t Build
With Excelmatic, you don’t need to build anything—you ask. Upload your Excel file and type:
1. Calculate total pay for each sales rep, including commission and bonus.
✅ Instantly outputs a clean table with all compensation values computed.

2. Highlight reps who earned more than $6,000 in total pay.
✅ Returns a flagged list of high earners with reasons why.

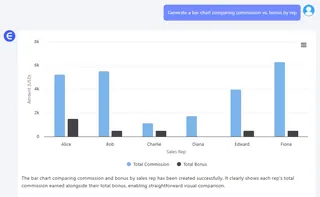
3. Generate a Bar Chart comparing commission vs. bonus by rep.
✅ Produces a ready-to-export chart perfect for presentations.

No formulas, no debugging, no worrying if that bonus rule got applied to the wrong row.
Real-World Example: From Clunky to Clear
Imagine Edward has a base salary of $4,150 and pulls in $22,000 in sales. In a traditional sheet, you’d write:
=4150 + (22000*0.05) + IF(22000>20000,500,0)
In Excelmatic? You just ask:
What is Edward’s total pay this month?
Done.
You can even follow up with:
Break it down by component.
And Excelmatic gives you base, commission, and bonus as separate line items.
Comparison Table
| Task | Traditional Excel | Excelmatic |
|---|---|---|
| Calculate commission | Manual formula | One plain-English request |
| Apply tiered bonuses | Nested IFs or lookup tables | Ask based on logic |
| Highlight high earners | Conditional formatting | Auto-flag based on criteria |
| Build charts for payout analysis | Insert + customize + style | Ask for a chart directly |
| Audit or modify logic | Trace cells and revise functions | Rephrase the question |
Final Thoughts: Precision Without Pain
Calculating bonuses and commissions is a task that demands precision—but it shouldn't demand your entire afternoon.
Excelmatic empowers finance and sales teams to move faster. You’re not writing IF formulas or formatting tables. You’re asking questions, getting answers, and spending your energy where it counts: making compensation fair, clear, and motivating.
So next time someone asks, "Can you show me Q2 commission breakdowns by region?"—don’t panic. Just upload the sheet, ask the question, and get the insights.
Let Excelmatic do the heavy lifting.


