There are AI tools everywhere now. Some promise a lot, some actually deliver.
We’ve tested a bunch of them — from Excel add-ons to AI chart designers — and here are the 5 that are actually useful if you spend your time on spreadsheets, dashboards, or reports.
Whether you’re cleaning messy Excel files, building charts for your team, or just trying to avoid another Sunday night PowerPoint rush… these tools can help.
1. Excelmatic — AI That Understands Spreadsheets
If you want one tool that can help with data analysis, chart creation, and summarizing insights, this is it.
What it does best:
- Turns raw Excel files into clear charts and reports
- Generates Bar Charts, pie charts, line graphs with just a question
- Gives you a written summary you can drop into a meeting deck
Here’s a sample dataset we used across tools:
| Month | Product | Revenue | Cost | Region |
|---|---|---|---|---|
| Jan 2024 | A | 12000 | 7500 | North |
| Jan 2024 | B | 9500 | 6000 | South |
| Feb 2024 | A | 14000 | 8000 | North |
| Feb 2024 | B | 10000 | 6500 | South |
| Mar 2024 | A | 16000 | 8500 | North |
| Mar 2024 | B | 11000 | 7000 | South |
Example prompt:
Compare monthly revenue by product and give a chart + analysis.
Best for marketers, analysts, team leads — anyone reporting data each week.
Free version available: Try Excelmatic
2. ChatGPT (OpenAI) — Smart Assistant for Formulas and Explanations
When I’m stuck on formulas — like, “What’s the cleanest way to sum this column only if the date is last quarter?” — ChatGPT is my go-to.
What it does best:
- Explains or fixes Excel formulas
- Suggests new formulas based on your logic
- Can help you write calculations without switching tabs to Google
Example prompt:
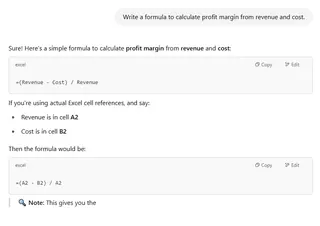
"Write a formula to calculate profit margin from revenue and cost."
Answer: =(Revenue - Cost)/Revenue
Best as a formula tutor, not a reporting tool.
3. Notion AI — Think, Write, Organize
Notion AI is less about crunching numbers and more about helping you make sense of them.
What it does best:
- Summarizes project updates
- Extracts action items from tables
- Writes status updates from messy notes
Example use:
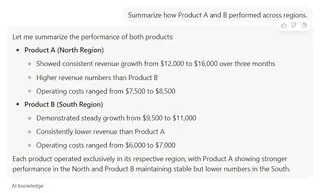
Paste in the sample dataset and ask:
Summarize how Product A and B performed across regions.
Great for PMs, ops folks, and team leads tracking lots of moving parts.
4. Rows AI — Smart, Collaborative Spreadsheets with AI Built In
Rows is like Google Sheets and ChatGPT had a smart, clean-looking baby.
What it does best:
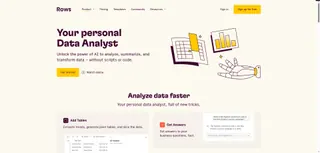
Integrates AI directly into spreadsheet cells
You can use functions like =AI() to summarize, extract, or generate content
Offers pre-built templates for marketing, finance, and analysis
Example input:
Use =AI("Summarize Q1 revenue trends") in a cell next to your data, and get a short write-up instantly.
Great for modern teams who want spreadsheets to do more than just calculate.
5. Canva Magic Design — Instantly Turn Ideas Into Slides
Charts are great — but sometimes you need to wrap them into a deck, fast.
What it does best:
- Converts text prompts into slide designs
- Has a drag-and-drop editor with AI-powered layout suggestions
- Templates for business, education, social media — everything

Example use:
Paste your Excelmatic summary into Canva and use Magic Design to create a slide from it — complete with visuals, color, and layout.
Best for presenters, freelancers, and people who don’t do design.
Final Thoughts
If you're working with data, you don't have to do it all manually anymore.
Use Excelmatic to turn spreadsheets into charts.
Use ChatGPT when formulas break.
Use Notion AI to summarize and report findings.
Use Rows AI to bring lightweight analysis and summaries directly into your spreadsheet.
Use Canva to package it all up and make it look great.
You don’t need 50 tools — just the right 5. Try one this week.

