Key takeaways:
- After a marketing campaign, the most time-consuming task isn't writing the presentation, but cleaning data, matching spend to conversions, and calculating ROI from messy spreadsheets—a process that can take a full day.
- The core advantage of AI data toolsis not just "speed," but "accuracy." They eliminate human errors common in VLOOKUPs and manual calculations, guaranteeing reliable results.
- With tools like Excelmatic, marketers don't need to memorize formulas. By using plain English commands, you can finish your core data prep in 10 minutes and focus on high-value strategic analysis.
A Marketer's Meltdown Starts with a Campaign Report
It's Monday morning. You've just wrapped up a two-week product launch campaign. Your boss asks for a performance report by the afternoon, with one key question: "How did we do? Was the money well spent?"
Your desktop is instantly cluttered with several Excel files:
- Ad Spend Report: Exported from your ad platforms, detailing daily spend per channel and ad group.
- Conversion Report: Exported from your e-commerce backend, showing each order's source channel and user ID.
- User Data Report: Containing user IDs and their registration details.
Your goal is clear: calculate the ROI (Return on Investment) for each channel.
But in Excel, this is where the nightmare begins:
- Matching Data: You need to use
VLOOKUPto connect your ad spend with your conversion data, matching them by "Channel" and "Date." One wrong parameter, and your screen fills with#N/Aerrors. - Cleaning Data: Channel names might be inconsistent across files—"Facebook_Ads" in one, "FB-Feed" in another. You have to clean them manually.
- Calculating Metrics: You create new columns on the far right, shakily typing long, complex formulas like
=(SUMIF(…)-SUMIF(…))/SUMIF(…)to get the ROI. - Summarizing for Insights: Finally, you carefully build a Pivot Table, hoping to figure out which channel actually performed best.
The morning flies by, and you're still wrestling with the spreadsheet. The real analysis—the "why"—hasn't even started.
AI Data Analysis: It's Not Just Fast, It's Accurate
Faced with this, many a marketer's solution is to learn more advanced Excel skills, but this often leads to a deeper "technical rat race." The smartest marketers are now turning to a new generation of solutions: AI data analysis tools.
These tools are revolutionary because they change the fundamental way we interact with data. You no longer have to learn the machine's language (Excel formulas); the machine learns yours (natural language).
Their core advantage lies on two levels:
- Efficiency ("Speed"): AI automates repetitive data processing, cutting down hours of work to minutes.
- Reliability ("Accuracy"): A
VLOOKUPerror, selecting the wrong range for a sum, or missing a row while copy-pasting—these are common human errors that can completely skew your analysis. An AI executes commands with 100% precision, eliminating these mistakes at the source and guaranteeing the reliability of your results.
So in the actual operational scenarios, how does the AI data analysis tool operate? Let's demonstrate with "excelmatic", this beginner-friendly AI tool that offers the quickest learning path, to show you how AI tackles marketing review step by step.

Walkthrough: A 3-Step Campaign Report with Excelmatic
Excelmatic packages the power of AI into an incredibly simple chat interface. Faced with the reporting challenge above, here's what you do:
Step 1: Intelligently Join Your Data (Replaces VLOOKUP)
Scenario: You need to combine the Ad Cost Report and the order Report to do your calculations.
Action: Simply drag and drop both raw Excel files into Excelmatic. Then, type in the chat box:
Join the "Ad Cost" table and the order table using the "Channel" and "Date" columns.
The AI automatically understands your multi-condition matching request, performs the work of a VLOOKUP, and gives you a single, clean master table.
Step 2: Calculate Metrics with Conversation (Replaces Complex Formulas)
Scenario: On your new master table, you need to calculate the ROI for each channel. Action: Continuing with the same table, just ask:
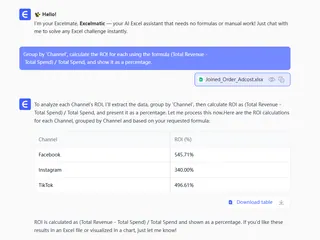
Group by 'Channel', calculate the ROI for each using the formula (Total Revenue - Total Spend) / Total Spend, and show it as a percentage.

You only need to define your business logic using words. The result is instant.
Step 3: Pinpoint Key Insights (Replaces Manual Filtering)
Scenario: You want to quickly find the best-performing ads from the campaign. Action: Using the master table from Step 1, issue your third command:
Present the ROI using a bar chart and arrange it in descending order of ROI.
Three sentences. Ten minutes. From raw data to final insight, the process is clear, the result is accurate, and you now have the rest of your day to think about what the data actually means.
What AI Data Analysis Brings to Marketers
- A Revolution in Efficiency: Compress a half-day or full-day reporting task into the time it takes to drink a coffee. It transforms you from a "data janitor" into a true "strategy analyst."
- Insight-Driven Decisions: When data prep is no longer a barrier, you can easily explore your data from various angles ("Which time of day has the highest conversion?" "What's the AOV difference between new and returning users?"), uncovering real growth drivers.
- Team Empowerment: It lowers the barrier to data analysis. Even a junior marketer can quickly get up to speed and independently produce high-quality reports, leveling up the analytical capability of the entire team.
FAQs: Frequently Asked Questions
1. What if my channel names don't match exactly across files? That's a key strength of AI tools. Before joining the tables, you can issue a simple command to clean your data, like: "In the 'Channel' column, change any value containing 'FB' to 'Facebook'." This ensures your analysis is accurate from the start.
2. Is the analysis from an AI truly reliable? Its reliability comes from the precision of its execution. As long as your command logic is clear (like your ROI formula), the AI's calculation process will be flawless—far more reliable than manual human work, which is prone to errors from fatigue or distraction.
3. Is this tool secure? Will my business data be exposed? Professional AI data tools like Excelmatic use bank-grade encryption and strict privacy protocols to ensure your data is used only for your own analysis. Your data is secure both in transit and at rest, so you can use it with confidence.
Stop the Grunt Work, Start Working Smarter
Your talent and energy belong to understanding customers, crafting creative campaigns, and shaping strategy—not to an endless battle with spreadsheets.
Choosing the right tool is the first step toward elevating the value of your work.
If you're also struggling with Excel reporting, try Excelmatic for free and experience the new workflow of finishing a campaign report in three sentences. Let AI become your most valuable team member and give yourself back the time to think.


