- The Challenge: Performance reviews often feel subjective and lack objective data, making it hard to provide actionable feedback.
- The Solution: Radar charts offer a brilliant visual of an individual's multi-dimensional skills, but are notoriously tedious to create manually in Excel.
- The AI Advantage: Upload a team's competency ratings sheet and use a single sentence to instantly generate a professional skill map for any employee.
You're in a one-on-one performance review with a top performer, John Miller. "John, you've had a great year," you begin. "You're a strong problem-solver, but I feel like your cross-functional communication could be a bit more proactive..."
John nods politely, but you can see a question in his eyes: "What does 'more proactive' actually mean?" How big is the gap? Compared to whom? Compared to his other strengths? This kind of "gut feeling" feedback, while well-intentioned, is often too vague to be actionable.
Now, imagine a different conversation. You pull up a chart on your screen that visually maps out John's strengths across key competencies like 'Strategic Thinking', 'Problem Solving', and 'Collaboration'. Pointing to a noticeably shorter axis on the chart, you say, "John, here's your competency profile. As you can see, you're off the charts in several areas. If we can bring your 'Collaboration' score up to par with the team average, your impact as a leader will be undeniable."
This transforms a standard review into a strategic, data-driven dialogue about growth.
The Manual Grind: The Hidden Cost of "Best Practice"
In theory, creating competency radar charts for team members is a modern HR best practice. In reality, it rarely happens. The barrier is the sheer manual effort required by traditional tools like Excel.
To create just one chart, a manager or HR professional must:
- Filter & Isolate Data: Hunt through a master spreadsheet to find and select the competency scores for a single employee.
- Copy & Reformat: Paste that data into a new, clean sheet, ensuring it’s structured correctly for Excel’s charting engine.
- Generate the Chart: Navigate through the
Insert > Chartmenu to find and select the correct Radar type. - Manually Tweak: Spend more time formatting the chart title, legend, and axes to make it presentable.
This tedious, error-prone process must be repeated for every single employee. It’s not strategic work; it’s a data entry marathon. It’s no wonder most managers abandon the idea and revert to less effective, conversation-based feedback.
How AI Frees You to Be a Coach, Not a Chart-Builder
AI tools change the game by acting as your on-demand data analyst. They handle all the messy, time-consuming steps so you can focus on what truly matters.
You no longer need to worry about how to build the chart. You simply state your analytical goal:
- Who to analyze: "Employee 'John Miller'"
- What to analyze: "His scores in Leadership, Collaboration, Problem Solving..."
- How you want to see it: "As a radar chart, benchmarked against the team average."
The AI does the filtering, formatting, and rendering in seconds, serving you a clear, visual insight. You are instantly elevated from a "chart-builder" to a strategic "coach" and "decision-maker."
Your Team's Data-Driven Co-Pilot: Excelmatic

Excelmatic is the smart analysis tool designed for managers and HR leaders who want to make data-driven talent decisions without the technical overhead.
- Core Function: Turns your raw performance data into clear, actionable insights through simple, conversational commands.
- How it Works: Upload your Excel sheets and chat with the AI just as you would with a data analyst or HR business partner.
- Pricing: A free trial is available, with the full Pro version priced at just $9.9/month, making data-driven talent management accessible to everyone.
Putting Excelmatic to Work: One Sentence to Map Anyone's Skills
Step 1: Prepare Your Competency Rating Sheet
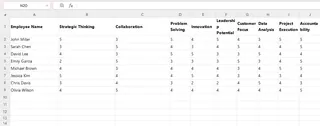
All you need is a standard Excel sheet containing your team's performance or competency ratings. The most common and effective format is a "wide table," where each employee has their own row, and each competency has its own column. Excelmatic is built to understand this format instantly.
For example, your spreadsheet might look something like this:
Step 2: Upload Your Data and Make Your Request
Upload your complete Excel file to Excelmatic.
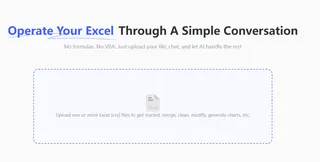
Because the data is in a clean, wide format, your request can be incredibly simple and direct:
Create a radar chart for the employee 'John Miller' based on his skill ratings.Pro Tip: The AI will automatically find the row for 'John Miller' and use the other numerical columns from that row as the axes for the radar chart.
Frequently Asked Questions (FAQ)
1. Q: Can I benchmark an employee against the team average?
A: Absolutely. This is one of the most powerful uses. After uploading your sheet, you can ask, "Create a radar chart that compares 'John Miller's' scores to the team average for each competency."This makes a person's relative strengths and development areas crystal clear.
2. Q: How can I compare two employees to see if their skills are complementary?
A: It's as simple as asking. Just type: "Show me a radar chart that compares the skill profiles of 'John Miller' and 'Sarah Chen'." This is perfect for team building and assigning partners to a project.
3. Q: Our company's competency model has over 8 dimensions. Will the radar chart still be effective?
A: Radar charts are best with 5-8 dimensions. If you have more, the chart can look crowded. You can easily solve this by being specific in your request, such as: "Create a radar chart for 'John Miller' focusing only on his leadership and execution skills." This keeps the visual focused and impactful for your conversation.
Turn Every Performance Review into an Opportunity for Growth
Great management starts with objective understanding.
By replacing vague "gut feelings" with a clear, data-backed competency map, you show respect for your employees and a commitment to their growth. You transform a potentially stressful conversation into a collaborative session focused on unlocking potential.
Start your free trial of Excelmatic today and create your first professional competency map in minutes.

