Key Takeaways
- Manually drawn flowcharts have high maintenance costs and quickly become obsolete in the dynamic e-commerce environment.
- The solution is to separate the process "logic" from the "visual design." You only need to maintain the logic, and the AI handles the drawing automatically.
- Use an Excel file as the "single source of truth" for your Standard Operating Procedures (SOPs).
- When a process changes, simply update the Excel file to regenerate an accurate flowchart in seconds, dramatically reducing maintenance overhead.
In e-commerce operations, a clear refund process guide is fundamental to ensuring customer service quality and team efficiency. Compared to text-only documents, flowcharts provide a more intuitive way to display every step and decision point, effectively reducing the learning curve for new employees and minimizing operational errors.
However, the task of creating and maintaining these flowcharts is itself often time-consuming and easily neglected. This article will demonstrate a new method that significantly improves the efficiency of updating flowcharts, helping e-commerce teams solve this common management headache.
Traditional Flowcharting Methods and Their Limitations
Traditionally, flowcharts are created using general-purpose drawing tools like PowerPoint, Visio, or online whiteboards such as Miro and Lucidchart. The process typically involves these steps:
- Outline the Steps: First, you identify all stages of the refund process (e.g., customer request, agent review, warehouse inspection, finance processing) and the decision criteria for each stage (e.g., "within 7 days?", "item in good condition?").
- Draw Manually: You drag and drop shapes from a toolbar onto a canvas—rectangles for steps, diamonds for decisions, etc.
- Add Text and Connectors: You type descriptions into each shape and then use arrow tools to connect them in logical order.
- Align and Format: You manually adjust the position of all shapes to ensure they are aligned with uniform spacing for readability.
The primary limitation of this method is its high maintenance cost. E-commerce is notoriously dynamic, with rules that change frequently due to new policies or major sales events like Black Friday. Every rule change means finding the source file and manually moving, adding, or deleting shapes and connectors—a tedious and error-prone process. As a result, many flowcharts are neglected, eventually becoming "zombie files" that no one trusts or uses.
What Is an AI Flowchart Generator?
An AI flowchart generator is a tool that automatically creates diagrams based on data or instructions provided by the user. Its core principle is to separate the "process logic" from the "visual rendering."
Instead of manually manipulating shapes, the user describes the process in a more structured format. The AI then parses this logic and automatically handles all the drawing, layout, and connecting tasks. This approach makes both creating and modifying diagrams incredibly fast.
How to Generate a Flowchart in 3 Steps with Excelmatic
The key to this new method is using a simple Excel file as the "single source of truth" for all process rules. When the process changes, we only need to maintain this file, not a complex diagram.
Excelmatic is an intelligent data analysis tool that applies this principle, simplifying the complex charting process into the following three steps.

Step 1: Upload Your File
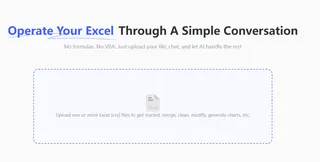
Directly upload the Excel file containing your predefined process rules to Excelmatic.

Step 2: Give the Command
In the chat box, type a clear command telling the AI what you want to do. For example:
Based on the uploaded file, generate a refund process flowchart
Step 3: Get Your Flowchart
The AI tool will instantly read the file's content and, within seconds, generate a flowchart that perfectly matches the logic in your Excel sheet. The resulting diagram is well-organized, accurately connected, and ready for team training or internal communication.
Frequently Asked Questions (FAQ)
1. Q: How is the privacy and security of my company's process files guaranteed?
A: We consider data security our top priority. Your uploaded files are used only for the current chart generation request and are not stored permanently on our servers. The entire transmission and processing are end-to-end encrypted, and your data will never be used for any other purpose, including model training.
2. Q: I'm not a technical person. Is this tool complicated to use?
A: Not at all. The entire workflow is simplified to "prepare an Excel file, upload it, and type one sentence." If you can use Excel, you can use this tool. It eliminates the hassle of learning the layout and functions of new drawing software.
3. Q: What is the core advantage of the AI method compared to traditional tools?
A: The core advantage lies in the efficiency of modification. With traditional methods, updating a flowchart might take half an hour of drawing and adjustments. With AI, your core task shifts from "drawing" to "maintaining rules in Excel." Anytime you need to update the process, you spend a few seconds changing a line of text in Excel and regenerate the chart. This dramatically lowers the maintenance cost and error rate of your process documentation.
Final Thoughts
Choosing the right tools can transform a team's workflow. By shifting flowchart management from a tedious "drawing task" to simple "rule maintenance," you can free up managers and team members from repetitive labor.
When updating process documents is no longer a chore, your team can be confident they are always using the most current and accurate guides. This has a direct and positive impact on service quality and operational efficiency.
If your team also struggles with outdated process documents, try Excelmatic today and experience the efficiency of this new working method firsthand.


