Key takeaways:
- Stop following generic "best time to post" guides. Every account's "golden hour" is unique and depends on the specific daily habits of your followers.
- AI chart generator tools can analyze the Excel/CSV data you export from your social media platforms, automatically correlating your post times with engagement data.
- Through visual analysis like bar charts and heatmaps, you can pinpoint the exact times each day of the week that will maximize your content's reach, ensuring your hard work gets seen at peak traffic.
You’ve just finished editing the video you’re sure will go viral, or you’ve written a deeply insightful carousel post. Now you face a critical decision: when do you hit “Publish”? You’ve probably read countless articles from "gurus" sharing universal advice: 8 AM, 12 PM, 9 PM… But when you post at these recommended times, your content often falls flat, with engagement barely making a ripple.
This frustration stems from a simple truth: the so-called "best time to post" might be the worst time for your account. Your audience has its own unique schedule and online habits. So, how do you find your true "golden hour"? The answer is hidden in your own data, and AI chart tools—especially AI bar chart generators—are the key to unlocking it.
What Are AI "Best Time to Post" Tools?
In reality, there isn't a dedicated category of tools called "AI Best Time to Post Analyzers." What we're actually talking about is a clever application of a broader category: AI chart generators or AI data analysis tools.
The core capability of these tools is to process spreadsheets you upload and, based on your instructions (usually in plain English), automatically perform analysis and create visualizations. For a social media manager, this means you can upload the content performance data exported from Instagram, TikTok, or YouTube, which includes columns for "Post Time" and engagement metrics like "Views," "Likes," and "Comments."
The AI tool reads this data and helps you answer questions like, "Which day of the week gets the highest average likes?" or "Do posts published in the evening get more views than those published in the morning?" Not only can it answer these questions, but it can instantly turn the answers into a clear bar chart or heatmap, making the insights obvious at a glance.
How AI Bar Chart Generators Find Your Golden Hour
For analyzing posting times, bar charts are one of the most effective and intuitive tools. AI makes generating them incredibly simple.
- Day-of-the-Week Analysis: You can tell the AI, "Create a bar chart with the day of the week on the X-axis and average views on the Y-axis." The AI will instantly generate a chart with seven bars, clearly showing you whether your content performs better on weekdays or weekends.
- Time-of-Day Analysis: You can drill down further by asking, "Looking only at Friday's data, show me a bar chart of average engagement rate for the morning, afternoon, and evening." This helps you narrow down the ideal time slot.
- Heatmap Generation: For the ultimate analysis, AI can create a Fan Activity Heatmap. It uses the day of the week as the X-axis and the hour of the day as the Y-axis, then fills in the grid with colors based on engagement levels. Deep red indicates peak activity, while cool blue shows when your audience is least active. This map becomes your account's personalized posting schedule.
- Natural Language Queries: Throughout this process, you don't need to write a single formula. You just ask questions as if you were talking to an assistant, and the AI handles all the data crunching and chart creation.
Benefits of Using AI to Analyze Posting Times
This data-driven approach transforms posting strategy from guesswork into a science, offering you tangible advantages.
- Maximize Initial Exposure: Posting when your audience is most active gives your content the best chance to get strong initial engagement, which is critical for triggering the platform's algorithm to show it to more people.
- Improve Efficiency: You no longer need to spend time guessing or running tedious manual A/B tests. A single AI analysis can provide clear direction.
- Make Data-Backed Decisions: When your boss or client questions your posting schedule, you can show them your data heatmap instead of just saying, "I have a good feeling about this time."
- Avoid Wasted Effort: Ensure that every piece of high-effort content you create gets its chance to shine in front of the largest possible audience, avoiding the regret of "great content, but no one saw it."
What to Consider When Choosing an AI Bar Chart Generator
The market is full of options, but for a social media manager, the choice should come down to a few key factors:
Data Handling: The tool must be able to intelligently handle the sometimes-messy date and time formats found in platform exports. A good tool will automatically recognize a column like "Oct-27-2023 18:30."
Ease of Use & Interaction: Prioritize tools that support "natural language queries." For a busy creator, being able to simply type a question in English is far more efficient than learning complex menus and drag-and-drop interfaces.
Chart Aesthetics & Customization: Are the generated bar charts and heatmaps clean and presentation-ready? Can you easily change colors or titles? This is crucial for creating reports.
Focus and Pricing: Some tools are massive Business Intelligence (BI) suites with steep learning curves. For a creator who just needs quick, insightful charts, a more lightweight and focused tool often provides better value.
Top 3 AI Bar Chart & Chart Generator Tools
Here are three excellent tools that can help you generate AI-powered bar charts to find your golden hour. Each has a different strength, catering to different types of users.
1. Excelmatic

Excelmatic is built for the creator or marketer who wants the fastest, most direct path from an Excel file to an answer. It integrates all its power into a single, simple chat interface, eliminating all complexity. If you want to quickly test a hypothesis about your posting times, it's nearly instantaneous.
- Conversational Analysis: Simply upload your Excel file with posting times and engagement data, then ask: "Compare the average number of likes for each day from Monday to Sunday using a bar chart." A perfect chart appears instantly.
- Minimalist Interface: There are no complex menus to learn. If you can type a question, you can perform professional data analysis.
- Smart Data Recognition: It understands date and time columns in your Excel file, allowing you to ask questions based on "hour," "day of the week," or "month."
- Lightweight & Web-Based: No installation required. It’s ready to go in your browser, fitting perfectly with the fast-paced, flexible workflow of a social media manager.
2. Canva (Charts Maker)
Millions of content creators worldwide use Canva daily. You probably use it for thumbnails or graphics, but it also has a powerful, AI-assisted chart maker. Its strength isn't in deep data analysis, but in its unbeatable aesthetics and ease of use.
- Beautiful by Default: Charts made in Canva are inherently well-designed, with modern color palettes and fonts. They are perfect for polished presentations or infographics.
- Rich Template Library: It offers a massive library of bar chart templates. You can simply input your summarized data (e.g., Monday: 100 avg. likes, Tuesday: 120…) and get a beautiful chart.
- AI Design Assistance: Enter your data and topic, and Canva's AI can even suggest color schemes and layouts for you.
- Seamless Workflow: After creating your chart, you can design your entire weekly report or performance review right inside Canva, making for a very smooth process.
3. Microsoft Power BI
Power BI is Microsoft's professional-grade business intelligence tool, and it's the "heavy-hitter" for analyzing Excel data. For teams or individuals who want to build a more systematic and in-depth data analysis practice, it's an excellent choice. The learning curve is steeper, but its power is unmatched.
- Powerful Time Intelligence: Power BI has built-in functions specifically for handling dates and times, making complex calculations like week-over-week growth easy.
- Deeply Interactive Analysis: The charts it creates are interactive. You can click on "Friday" in a bar chart, and all other charts on your dashboard will instantly filter to show you only Friday's data.
- AI Q&A Feature: Similar to Excelmatic, it supports creating charts by asking questions in natural language, which lowers the barrier to entry.
- Automated Dashboards: You can build a "Posting Time Analysis Dashboard" once, with heatmaps and bar charts, and then simply refresh the data source each month to update the report automatically.
AI To Find Golden Hour (FAQs)
Don't the platforms already have analytics? Why do I need another tool? Platform-native analytics are often rigid and limited. You can't perform custom cross-analysis (e.g., "Show me the performance of posts on this specific topic at different times"). A third-party AI tool gives you the flexibility to explore your data based on your own curiosity.
I don't have a lot of data. Is it still useful? Absolutely. Even with data from just a few dozen posts, an AI tool can help you spot preliminary patterns, which is far better than guessing. As you publish more content, these patterns will become clearer and more reliable.
Can AI guarantee I'll post at the best time, every time? AI provides the "highest probability answer" based on your past data; it can't predict the future with 100% certainty. However, it can dramatically increase your odds of success, moving you from a random 10% chance to a data-backed 80% chance. That's a huge leap.
Excelmatic: Find Your Golden Posting Time in 3 Steps
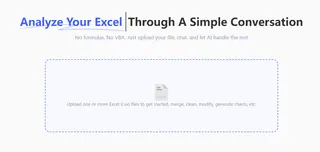
Step 1: Upload Data
Drag and drop your Excel file containing "Posting Time" and "Engagement Metrics" (e.g., impressions/likes) directly into Excelmatic.
Step 2: Send Instructions
Want to know which day of the week (Monday to Sunday) performs best? Just ask:
Display the average "Impressions" grouped by "Posting Day of the Week" using a bar chart.
The chart will immediately show you which day has the highest average traffic. Suppose the result is "Friday".
Now, let’s focus only on Friday’s data to find the optimal hour for posting. Tell the AI:
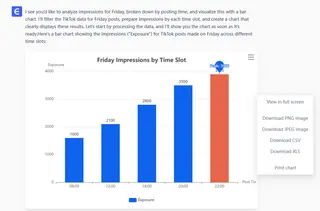
Filter the data for "Friday" and display the impressions across different time slots on Friday using a bar chart.
The results are clear at a glance. The new chart clearly shows that 10:00 PM on Friday is your traffic peak.
Now you have a data-backed, precise posting time.
Step 3: Download Your Chart
Excelmatic supports downloading charts in multiple formats. You can download them as charts, files, or record them as GIFs to share and discuss insights with your teammates.
Find Your Golden Hour with Excelmatic
Stop letting your brilliant content go unnoticed because of bad timing. Excelmatic simplifies complex posting-time analysis into a simple conversation. Just upload your data, ask your question in plain English, and let the AI do the rest.
Whether you need a bar chart comparing day-of-the-week performance or a heatmap to reveal your true audience activity, it’s just one sentence away.
Try Excelmatic for free today and stop guessing. Make every post count by hitting "Publish" at your true golden hour.


