In today’s business world, data is key to making decisions. But using traditional Excel for data processing can be slow and difficult, especially when dealing with lots of data. Manual work is not only inefficient but also error-prone.
Thankfully, with advancements in AI, a tool called Excelmatic has been developed. It brings AI into Excel, making data analysis much easier and more efficient. Let’s take a look!
Excelmatic: User Guide
- Register and log in to the website: Visit the Excelmatic website and log in to your account.

- Upload Excel files: Upload Excel files to Excelmatic. The system supports all common Excel formats (.xlsx, .xls, .csv).

- Ask questions in natural language: Once the file is uploaded, you can start asking questions in natural language, such as:
Help me count the total sales each month.
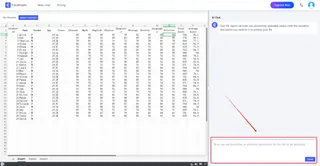
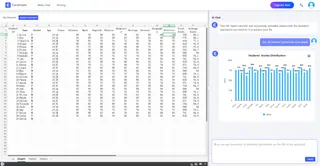
- Get Analytics Reports: Excelmatic will immediately process your request and get detailed data analytics reports, highlighting key metrics and trends and providing data interpretations and recommendations, with support for automatically generating data visualization charts.
Excelmatic Features and Use Cases
Data Cleansing and Batch Operation
Excelmatic supports batch processing of data, quickly completes data cleaning tasks, and helps users deal with blank values, inconsistent formatting and other problems in data.
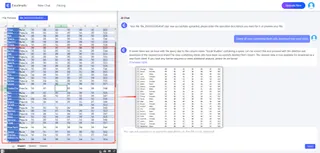
- Delete Blank Cells: Enter the command
Delete all rows containing blank cells, and Excelmatic will automatically complete the operation.
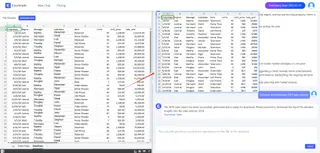
- Batch Extraction of Data: Enter
Extract data with a total score greater than 500 points and download the formto quickly filter out the required data.
Data Arithmetic
Excelmatic is able to quickly complete complex arithmetic tasks without the need to manually write formulas:
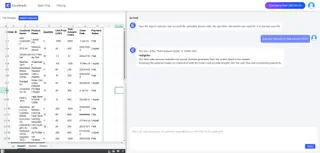
- Summing: Enter
Calculate the sum of Total amount (USD)and Excelmatic will automatically filter and calculate the result.
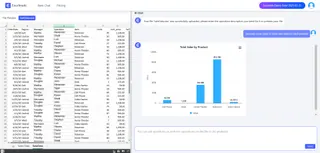
- Bar Chart: Enter
Generate a Bar Chart of total sales data for each product, then you can quickly generate a chart.
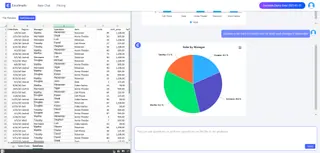
- Pie Chart: Enter
Generate a pie chart of product sales for which each manager is responsible, Excelmatic will generate a pie chart based on the data.
Data Analysis
Excelmatic is capable of performing in-depth data analysis to help users quickly understand data trends and relationships:
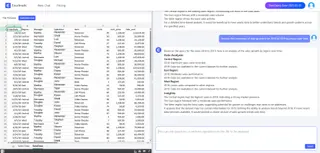
- Correlation Analysis: Enter
Analyze the correlation between the growth of data by region and time from 2018 to 2019and Excelmatic will automatically calculate the correlation coefficient and generate a chart.
Conclusion
AI-powered tools like Excelmatic are redefining the way Excel is used. They not only simplify the data processing process, but also lower the threshold for users, making it easy for even Excel novices to get started. If you are still bothered by the tedious Excel operations, why not try Excelmatic and let AI bring higher efficiency and smarter experience to your work?


