Have you ever experienced this:
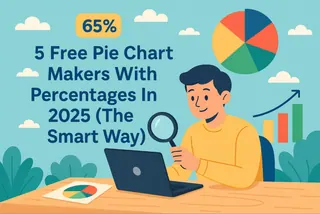
Spent 10 minutes organizing data, but wasted 1 hour on pie chart labels? Labels either overlap into a mess and become unreadable, or values are placed incorrectly. Once finally adjusted, if the data changes, you have to start over.
Finally, after sending out the chart, the boss says, "This number is unclear, redo it," and all previous effort is wasted.
Don't Underestimate Labels: They Can "Appreciate" Your Data or "Depreciate" Your Efforts
Many people think "labels are just a small thing," but in actual work, they directly affect decision quality:
- When reporting sales proportions, blurry labels may cause the team to misjudge core business;
- In budget meetings, misplaced values might make the boss think a department is overspending;
- When communicating with clients, a chaotic pie chart can even lower your professionalism.
Good Labels Can Make Data "Speak for Itself":
- At a glance, see "which business accounts for 60%," without guessing from the sectors;
- Precisely label "3 small items totaling 15%," avoiding key information being overlooked;
- Simultaneously display "value + percentage," so the boss understands the key points with one scan.
However, manually adjusting labels is simply "thankless work." Why say that?
Once data updates, labels "run amok"; with more categories, text squeezes into an "ant pile"; finally aligned, but the format doesn't match the previous report.
No wonder some say: "The time spent making pie charts is enough to write 3 analysis reports."
Tip: With the "Excelmatic" AI tool, you don't need to add labels manually. Upload the data and send an instruction like "Help me generate a pie chart and add appropriate labels to it," and AI will automatically generate a chart with labels for you.*
The Pitfalls of Traditional Pie Chart Making, You've Definitely Stepped In
Open Excel, isn't this how you operate?
① Select data, insert pie chart—done in 10 seconds, okay;
② Right-click "Add labels"—they appear, but positions are all messed up;
③ Drag labels one by one, adjust fonts, change formats—half an hour passes, eyes sore, labels still "fighting";
④ Discover data miscalculation, after fixing, look back: labels all misaligned, have to redo……
Worse still, after staying up late to revise the 5th version, being told "missed labeling a value"—who understands this frustration?
Use "Excelmatic", Make "Zero-Error" Pie Charts in 3 Steps
Now, you no longer need to worry about these things.
"Excelmatic", this practical AI tool, compresses "1 hour adjusting labels" into "3 minutes done," even beginners can create professional-level pie charts.
3 Steps to Perfect Pie Chart, No Hassle Throughout:
- Upload Data: Upload file (supports Google Sheets/Excel/CSV);
- Describe Needs: For example: "Make a pie chart of sales proportions by region, labels to show value + percentage, colors use brand colors";

- Wait for Results: In 10 seconds, AI automatically generates the pie chart—labels neatly arranged, values zero errors, colors and fonts all adjusted, ready to use.
More crucially, when data changes, the chart syncs automatically. For example, last month's sales update, no need to readjust labels, AI will real-time align values and positions, no more repetitive labor.
Not Just Fast, But Makes Your Charts "Win in Details"
Excelmatic's AI not only "saves time," but also turns charts into bonuses:
- Intelligent label avoidance: No overlapping even with many categories, clear even on mobile;
- Dynamic interaction: Hover mouse over sector, automatically show details (e.g., "East China: 580,000, 32%, up 15% YoY"), super eye-catching in reports.
- Intelligent prediction: AI will give you future predictions or suggestions based on your data, so you can understand the information behind the chart, no more worrying about not understanding it.
User feedback: "Pie charts made with it in PPT, client said on the spot 'Your data is really professional,' directly signed quarterly contract."
Say Goodbye to "Pie Chart Anxiety", Click to Experience
You no longer need to stay up for labels, worry about data changes causing chart "flops," or let unprofessional charts drag down results.
Excelmatic's free membership allows 20 free conversations—upload data, say a word, get a pie chart with perfect labels.
👉 Click here: Try Now , let AI handle pie charts for you, use the saved time for more valuable analysis.
No more "deadlock" with labels. Try it now, make your data visualization fast and professional.

