💡 Key takeaways
- The real challenge of year-end budgeting isn't the data itself, but the time-consuming process of transforming vast, scattered expense sheets into actionable insights.
- AI assistants are evolving workflows from tedious "spreadsheet building" to efficient "conversational analysis," freeing up managers to focus on strategy and decision-making, not manual operations.
- This article demonstrates how to use a next-gen AI tool to streamline the entire process—from annual review to new year planning—with a simple
'upload + ask'model.
As a manager, you know that a well-crafted budget is the blueprint for the year's success.
But every year-end, the process begins with the same daunting task: a detailed annual expense review and a data-driven budget proposal. You export the full year's expense ledger—an Excel file with thousands upon thousands of rows.
In the past, this marked the start of an uphill battle. It's a process that doesn't just drain your patience but also eats into the valuable time you need for strategic thinking. Now, AI-powered tools are revolutionizing this time-consuming task.
The Pain of Traditional Year-End Budgeting: Three Major Roadblocks
With the traditional approach, managers often hit three critical roadblocks on the path from raw data to final decision:
1. The Data Aggregation Black Hole: You spend hours manually wrangling data with PivotTables and complex formulas just to categorize and consolidate expenses by department, project, or cost center. It's a repetitive, mechanical process that consumes a massive amount of your time and energy.
2. The Barrier to a Real Deep Dive: Even after the reports are built, trying to answer deeper questions like, "Why did this department's spending spike?" requires another round of complicated filtering and calculations. As a result, the analysis often remains superficial, failing to produce real, actionable insights.
3. Lagging and Disconnected Planning: The heavy lifting of the review process often means the new year's budget is based on guesswork or past experience rather than a detailed analysis of the previous year's actuals. This disconnect between planning and reality can lead to costly misallocations.
A Workflow Revolution: Swapping Clicks for Conversations
Excelmatic was engineered to solve this very problem. Think of it as an "AI Analyst" embedded directly within Excel, designed to deliver a fundamentally new way of working.

The core change is a shift in your role: from a data "doer" to a strategic "decision-maker." Your focus moves from "How do I build this in Excel?" to "What is this data telling me about the business?" You drive the entire analysis by simply asking questions, just as you would with a human colleague, allowing you to focus completely on the business implications.
Excelmatic in Action: Your 3-Step Guide to Effortless Budgeting
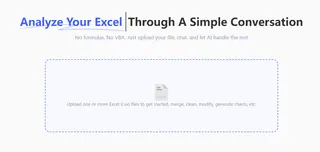
Getting Started: Open the Excelmatic sidebar and upload your annual expense file.
Step 1: Get the Big Picture (Global Review)
First, you need a high-level overview of the entire year's spending. You simply type your request:
"This is the full-year expense data. Summarize the total spending by department and show me the proportions in a chart."
In seconds, the AI generates a summary table and an intuitive pie chart. You can see each department's spending scale and share at a glance.
Step 2: Drill Down to Uncover Core Issues
From the chart, you notice the Marketing department accounts for the largest share of spending. To understand why, you continue the conversation:
"Great. Now, do a deep dive into the Marketing department. I want to see a breakdown of their main expense categories."
Excelmatic instantly creates a bar chart that clearly breaks down Marketing's spending into categories like "Ad Spend," "Events," and "Content Creation," ranking them by amount. This helps you immediately pinpoint the key cost drivers.
Step 3: Plan for the Future
With the review complete, you can now move on to planning. Based on your analysis and the upcoming year's strategic goals, you issue a planning command:
"Based on this year's actuals, draft a budget for the new year. Increase the R&D budget by 20% for a new project, decrease Marketing by 10%, and keep all other departments the same."
The AI handles all the calculations and generates a clean, structured budget proposal for the new year. This data-backed plan provides a solid foundation for productive discussions with senior management.
Frequently Asked Questions (FAQs)
Q: Can the AI handle the complex, real-world spreadsheets from our finance system? A: Yes. Excelmatic's AI is designed to understand messy, real-world tables. It automatically identifies key columns like "Department," "Amount," and "Date," even if the names or order aren't perfectly standard.
Q: Our financial data is highly confidential. Is it secure? A: Data privacy is our top priority. Excelmatic offers on-premise deployment, which means all your data and analysis remain entirely within your company's private network. No data is ever sent to external servers, ensuring complete confidentiality.
Q: Do I need to learn specific command formats? A: Not at all. Excelmatic understands natural language. You can simply express your needs in your own words, just as if you were talking to a colleague.
Conclusion
The true value of year-end budgeting isn't in creating a perfect spreadsheet. It's in gleaning insights from the past to make smarter resource allocation decisions for the future.
Excelmatic is the tool that makes this possible. It frees managers from the "grunt work" of data manipulation and gives them back their most valuable asset: time to think and strategize. It empowers professionals to do what they do best. It's time to embrace a smarter, more insightful way of working.
Try Excelmatic now and master your next budget planning cycle.

