Key Takeaways
- The Problem: Manual Excel work consumes hours that should be spent on business analysis and decision-making
- The Solution: Excelmatic creates professional sales dashboards automatically using simple English commands - no formulas needed
- The Benefit: Transform hours of work into 3-minute tasks while eliminating manual errors
- The Outcome: Focus on strategic insights while AI handles the technical spreadsheet work
Scenario: Data to Dashboard Under Time Pressure
A sales director faces a 3 p.m. review. He holds five region reports in different formats. He must present performance and trends. Manual merging and charting would take half a day. The director cannot afford that delay.
This problem occurs in many offices every day. Teams should focus on business insight, not technical details.
Root Causes: Three Bottlenecks in Traditional Excel Work
Complex Data Processing: Users must merge tables and clean duplicates. These steps are error-prone and slow.
Formula Barriers: Functions like VLOOKUP and SUMIF intimidate many users.
Time-Consuming Chart Creation: Users must select data, adjust formats, and refine visuals.
Solution: Build a Sales Dashboard with Excelmatic in Three Steps
Excelmatic offers a simple workflow. Users do not need to memorize formulas. They only need to provide clear instructions.

Step 1: Upload the File
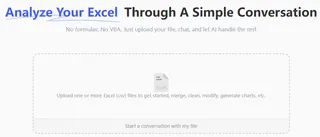
Drag the messy Excel file into Excelmatic. The platform accepts files without prior formatting.

Step 2: Give Clear Instructions
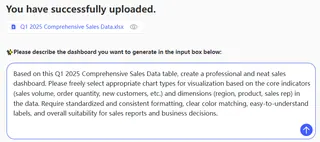
Type your request in plain language, for example:

Step 3: Receive the Dashboard
Excelmatic processes the data, performs calculations, and generates charts. The platform delivers a polished, interactive sales dashboard. You can edit, save, and share it directly with others for collaborative viewing and analysis — all within Excelmatic.
Why Choose Excelmatic
- Speed: Compresses hours of work into minutes
- Accuracy: Avoids common manual mistakes
- Accessibility: No formula mastery required
- Intelligence: Understands business context and provides insights
Core Functions
| Function | Capability |
|---|---|
| Table Assistant | Cleans, merges, and organizes data automatically |
| Data Analysis | Runs complex statistics and calculations |
| Data Visualization | Creates professional charts and dashboards |
| mage/PDF to Data | Extracts usable data from images and PDFs |
| Smart Decision Support | Highlights patterns and trends in data |
Frequently Asked Questions
Q: How accurate is Excelmatic's data analysis compared to manual work?
A: Excelmatic usually produces more accurate results than manual work. The system reduces human error. The AI applies rules and calculations consistently across all data. This consistency prevents mistakes that come from fatigue in manual processing.
Q: Can I use Excelmatic with very large Excel files?
A: Yes, Excelmatic handles large datasets efficiently. The platform scales to meet common business needs. Very large files over 100 MB may take longer to process. Most business files finish within one to two minutes.
Q: What if I need to make changes to the dashboard after it's created?
A: You have two simple options. You can regenerate the dashboard with updated instructions. You can also use Excelmatic's edit mode to adjust charts and labels. Many users prefer regeneration for quick, broad changes.
Ready to Transform Your Excel Experience?
Focus on strategy and decision making rather than spreadsheet mechanics. Discover how Excelmatic can enhance your team's productivity by handling the technical work.
Try Excelmatic for free today - transform chaotic data into clear insights in just three minutes.


