Let’s face it—Excel can do a lot, but making charts that tell the right story? That’s still a job with too many clicks, filters, and formula fiddles. But not anymore.
Welcome to a smarter way of working. In this article, I’ll walk you through the top AI tools for generating Excel charts in 2025, starting with the most powerful and intuitive one I’ve used—Excelmatic. If you've ever wished you could just ask Excel to "show me what's going on," you're going to love this.
Excelmatic – Ask, Chart, Understand
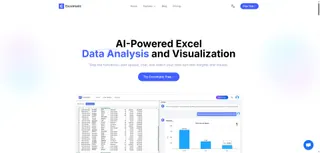
Website: https://excelmatic.ai
Price: From $5.99/month (basic plan)
Excelmatic isn’t just another chart maker. It’s built for people who work in Excel daily and want quick, smart, visual answers to real business questions. You don’t need to learn a new interface, write code, or prep your data—it works directly with your existing Excel files, interpreting natural language prompts to produce charts, clean data, and contextual insights.
Real Chart Examples with Excelmatic
Here’s what I asked using a monthly revenue-expense Excel sheet:
Prompt 1: “Show a clustered column chart comparing Revenue and Expense by Department in March.”
Insight: Sales and IT had the highest revenue, but IT's expenses ate most of it. Marketing had strong margins despite moderate revenue.
Prompt 2: “Generate a line chart of monthly revenue trends for each department.”
Insight: Finance showed consistent growth. Sales fluctuated sharply, while Marketing and HR had opposite trends—one steady, one spiky.
These charts weren’t just pretty. Excelmatic added clear narratives about what the visuals meant. That’s the magic—understanding without overthinking.
2. ChartGPT by PromptLoop

Website: promptloop.com/chartgpt
Built as a Google Sheets extension, ChartGPT lets you describe the chart you want in a prompt and generates it right into your spreadsheet. While it’s not as detailed in its feedback as Excelmatic, it’s fast, and it works well if you’re deep in the Google ecosystem.
Best for: Google Sheets users who want instant chart previews via AI.
Pricing: Free for limited use, Pro starts at $19/month.
3. Pigment

Website: gopigment.com
Pigment is more of a business planning platform, but it now integrates AI chart suggestions based on Excel data imports. If you handle financials or KPIs and want dynamic dashboards with AI-augmented design, Pigment is worth a look.
Standout feature: Forecasting + visualizations in one, with Excel import/export.
Pricing: Enterprise model, pricing on request (starts ~$80/month per user).
4. Plus AI (Chart Tool)

Website: plusdocs.com
Plus AI helps you turn web data or spreadsheets into charts and slide decks. It’s particularly useful if your final output is in Google Slides or PowerPoint, and the AI supports chart recommendations.
Why it’s useful: If your job includes reporting with Excel + Slides, Plus saves hours weekly.
Pricing: Free limited plan, paid starts at $10/month.
5. Power BI + Copilot

Website: powerbi.microsoft.com
Okay, Power BI isn’t new—but Microsoft’s integration of Copilot AI has changed the game. Now you can ask natural-language questions like "Show sales by region for Q2" and it’ll generate visuals for you.
Who should use it: Advanced users with structured Excel data and enterprise dashboards to build.
Pricing: Power BI Pro is $10/user/month, Copilot features included with Microsoft 365 licenses.
Why Excelmatic Stands Out
Most tools on this list focus on charting. Excelmatic goes beyond that. It understands the question behind your data. You don’t need to remember which chart type to use or how to clean the dataset—it does both. And the insights it offers? They make it feel like you’ve got a data analyst sitting beside you.
If you’ve ever spent 15 minutes wrestling a pivot table just to learn what Excelmatic tells you in 5 seconds, you know what I mean.
Just Ask It
Before you scroll on, try asking these in Excelmatic:
- “Compare revenue and expenses per department for March.”
- “Which month had the highest net profit?”
- “Show a bar chart of monthly profits by team.”
If your spreadsheet has the data, Excelmatic has the story—and the chart to show it.
Ready to turn your spreadsheet into insight? Try Excelmatic now and let your data finally speak.
If you are interested in Excel AI charts, you may also like the following articles:
Which Products Are Quietly Failing? Let a Bar Chart Maker Show You the Ratings
Track Monthly Sales Trends in Seconds with Excel AI Line Chart
Compare Brand Sales Trends with Multi-Line Chart in Excel AI
Visualize Category Sales by Region with Donut Charts in Excel AI
Compare Seasonal Sales Trends with Multi-Line Excel AI Charts
What’s Your Best-Selling Product? Find Out Instantly with This AI Chart Maker

