I just wanted to get the report done — That’s when I tried Excelmatic
Let’s be honest — it’s not that I hate Excel.
I hate writing formulas. I hate formatting. I hate building charts that still need explaining.
So when I first tried Excelmatic, I didn’t expect much.
But it completely changed how I handle data.
✅ No formulas
✅ No chart building
✅ No endless Googling functions
✅ Just ask your question — AI takes over
A Real Case: Let Excelmatic Handle the Reporting
We had to create a quarterly sales analysis report with:
- Monthly sales trends
- Regional breakdown
- Top-selling products
Normally, here’s the grind:
- Prep the raw data
- Write
SUMIFS,IFERROR,VLOOKUP - Build pivot tables and charts
- Write clean analysis text with insights
With Excelmatic, I just typed:
Please analyze this sales data and generate charts and insights, including region comparison, time trends, and top-selling products.
And here's what AI delivered:
- A line chart showing monthly trends
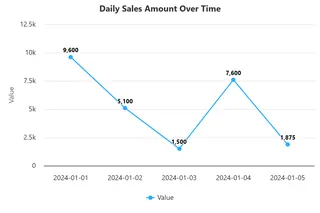
- A regional Bar Chart, well-sorted and colored
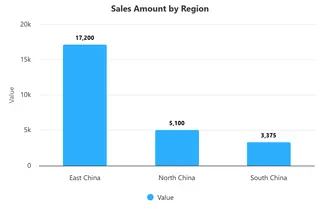
- A top products ranking chart
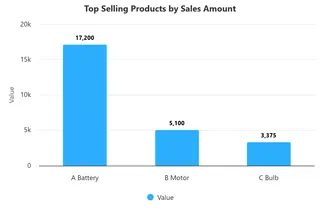
- A summary with real insights — peak months, standout regions, product impact
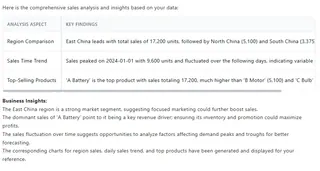
It even wrote the kind of paragraph I could drop straight into an email to my boss.
How It Works: 3 Simple Steps
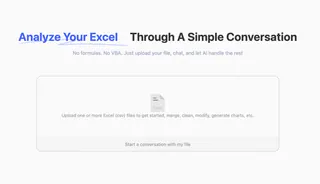
Step 1: Upload your Excel or CSV file
No need to clean or format — we’ll read it for you
Step 2: Ask your question
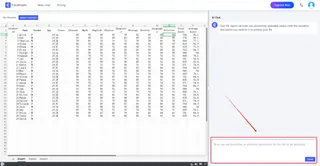
Just type what you want to see:Can you summarize this dataset with charts and a report?
Step 3: Get your results
Charts + insights, ready to copy, export, or plug into a slide deck
Excelmatic flips the usual script: You don’t learn Excel — Excel learns you.
Forget Formulas. It's All About the Questions Now.
There’s a quote we love:
Excel is meant to serve people — not the other way around.
Excelmatic lives this idea.
You don’t need formulas.
You don’t need to know what a pivot table is.
You don’t even need to pick a chart type.
Just ask — and it builds the rest.
Sign up today and try Excelmatic for free
Try Excelmatic Free today!


