When the department manager gave you an Excel file and asked you to create a flowchart based on it, did you spend 2 hours manually inputting hundreds of data rows into the flowchart tool, adjusting the positions of the nodes, and then having to re-align the lines when modifying the data...
No matter who recommends a good flowchart-making tool to you, you will inevitably encounter the repetitive task of inputting individual nodes and manually adjusting their positions. This is because you only think of drawing it yourself instead of having someone else create it for you, handing the task over to AI, inputting the commands, and it can complete your work in just a few seconds.
The 3 major "thugs" in traditional flowchart creation - have you ever been targeted?
- Node Mover:
Manually copy the departments, steps and data from Excel to the flowchart tool. It will take at least one hour for 100 nodes.
- Knot Weaver
Adjust the direction of the arrows and the spacing between the nodes. It took a lot of effort to arrange them neatly, but changing just one piece of data completely messed everything up.
- Version Schizophrenia:
After the Excel data was updated, the flowchart was not synchronized. When reporting, it was embarrassing to find that the data and the charts did not match.
When creating a flowchart, the most frustrating part is never the logical organization, but rather these mechanical operations. The "Excelmatic" practical AI tool is recommended for you. It can collect data from files and enable you to generate a smooth flowchart in just a few seconds.

Efficient AI-Generated Flowcharts:
The efficiency of AI-generated flowcharts is demonstrated in three core aspects: time compression (reducing from hourly to second-level), logical consistency (automatically identifying Excel data correlations to generate closed-loop processes), and dynamic response (immediate updates to the charts when data sources change).
Whether it's a complex swimlane diagram for cross-departmental collaboration, or a branching process with data thresholds, all can be implemented with a single natural language instruction, completely eliminating the predicament of "taking half an hour to draw the process and another two hours to adjust the format".
Just two steps: Excel data → Professional flowchart
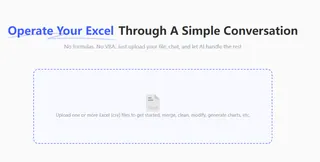
1.Open "Excelmatic" and upload Excel: Drag the table containing process steps, responsible persons and data indicators into the tool
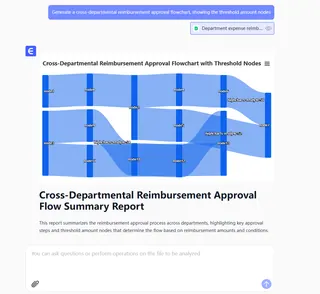
- Enter simple instructions, such as "Generate a cross-departmental reimbursement approval flowchart, showing the threshold amount nodes"
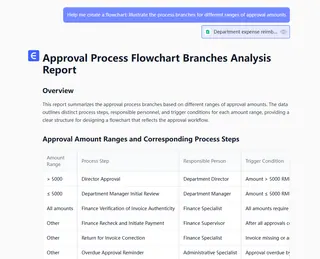
or"Help me create a flowchart: Illustrate the process branches for different ranges of approval amounts"
This saves you more than half the time compared to making it yourself.
What professionals really need is not "drawing tools", but "data visualization translators".
The most remarkable aspect of AI tools lies in:
It understands the formula logic of Excel and can extract process nodes from the results of VLOOKUP.
It understands the laziness needs of office workers. There's no need to learn the shortcut keys of Visio; just being able to type will enable you to use it.
It understands the pain of data synchronization and completely eliminates the chaos of "one version for the table, another version for the flowchart".
Make good use of AI tools, and drawing flowcharts no longer requires opening two software programs and switching back and forth. This saves you at least 1 hour each day to do other things. The secret to improving workplace efficiency often lies in "using the right tools". Why bother suffering yourself when there are things that AI can do?
If you are interested in Excel AI charts, you may also like the following articles:
Compare Ad Channel Sales with a Bar Chart in Excel AI
Track Monthly Sales Trends in Seconds with Excel AI Line Chart
Compare Brand Sales Trends with Multi-Line Chart in Excel AI
How to Instantly Spot Repeat Buyers vs Newbies Using AI Charts
Which Products Are Going Viral? Track Popularity Momentum with AI Charts

