In the era of digital office, whether for learning or work, when presenting reports, it is always necessary to visualize data in the form of charts. However, creating charts usually takes a lot of time. Utilizing AI tools to convert Excel files into charts not only saves time but also provides us with accurate analysis.
At present, there are many AI table processing tools available on the market. Here are some commonly used table processing websites.
Five commonly used AI-based website for table processing
1. Excelmatic:
feature:
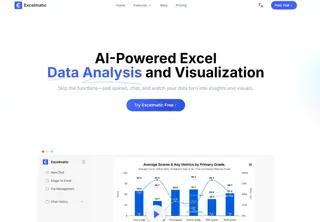
Natural language interaction. Just input daily conversation-style instructions such as: "Generate the sales report for Q3 2024", and the AI can automatically complete data cleaning, formula generation, and chart visualization.
It supports a one-stop operation from data extraction, format standardization to dynamic chart generation. It is particularly good at handling data in irregular texts and images. It has built-in trend prediction and anomaly detection functions. For example, if you input "Analyze the reasons for the fluctuations in sales in each region", the system will automatically generate a visual report with conclusions.
Covering areas such as finance, marketing and education, it provides industry-specific templates (such as medical data cleaning, e-commerce sales forecasting), thereby lowering the professional threshold.
The mobile version is not yet available. For now, it can only be used through the website.
website: https://excelmatic.ai/
2. Sheetsgpt:
feature:
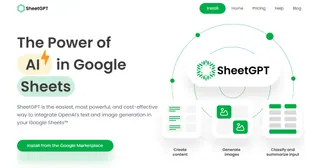
Users do not need to remember complex formulas. By simply describing the requirements in English (such as "Calculate the average value from C2 to C11"), the corresponding formula can be generated, thereby lowering the technical threshold. It is seamlessly integrated with Google Sheets, supporting real-time sharing and editing among teams, and is suitable for collaborative scenarios.
It covers multiple scenarios and can handle tasks such as data summarization, filtering, ranking, and chart generation, even across Sheets.
Based on finely tuned AI models, the accuracy of the generated formulas is high, saving time spent on manual writing.
Limitations: Requires internet connection. May not perform well when handling large amounts of data or nested formulas. Manual optimization is required. Basic functions are free, but advanced functions require subscription and payment.
3. ExcelHelper:
feature:
Using the OCR technology, the data in paper forms or images can be quickly converted into editable formats.

Support the direct invocation of AI functions by the WeChat official account. Team members can synchronize and edit in real time through the link.
Covering 15 scenarios such as supply chain management, human resources, social media analysis, etc., it can automatically generate complex charts like Gantt charts and heat maps.
Limitation: The free version has limited functions. Advanced chart generation requires upgrading to the professional version.
4. Probably:
feature:
Run pandas/matplotlib code directly in the browser, supporting processing of millions of rows of data. Users can customize the AI prompt library, which is suitable for developers to build automated data analysis processes.
Implementing data processing locally through WebAssembly to avoid the risk of data leakage in the cloud.
Scientific research data analysis, financial transaction processing, and complex modeling that requires deep programming.
Limitations: It has a relatively high barrier for non-technical users and the visualization function is relatively basic.
5. ChatExcel:
feature:
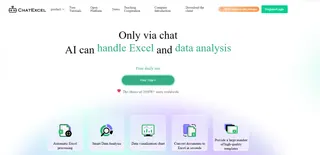
Supports simultaneous processing of 5 related tables, suitable for cross-validation of data across departments. Offers over 400 advanced functions, capable of generating complex reports with formula explanations.
The enterprise customized version offers API interfaces and dedicated servers to meet high concurrency requirements. It is suitable for university research, large enterprises'
financial analysis, and scenarios that require in-depth formula applications.
Limitation: The daily processing volume of the free version is only 10 times. The price of the professional version is relatively high for small and medium-sized teams.
How to Choose the Most Suitable Tool?
- Pursuing ultimate privacy: Opt for SheetNext or Probly. The former focuses on fast local processing, while the latter is suitable for technical users to customize privacy policies.
- Mobile devices and collaboration needs: The WeChat integration and multi-end synchronization features of ExcelHelper are superior.
- Complex data analysis: ChatExcel's professional function library and multi-table correlation capabilities are more suitable for academic or enterprise-level scenarios.
- Comprehensive cost-effectiveness: Excelmatic achieves the best balance in terms of comprehensive functionality, ease of use, and pricing, making it particularly suitable for small teams and individual users.
Summary
Excelmatic overcomes the traditional problems of time-consuming and error-prone data tabulation through its three advantages: natural language interaction, full-process automation, and intelligent insight analysis.
Compared with SheetNext's template dependency, ExcelHelper's limited functions, Probly's technical barriers, and ChatExcel's high costs, Excelmatic is more competitive in terms of user-friendliness, multi-scenario adaptability, and long-term usage costs. Whether it is processing daily sales data or building enterprise-level dashboards, Excelmatic can help users extract value from data with lower learning costs and higher efficiency.
If you are interested in Excel AI charts, you may also like the following articles:
Compare Ad Channel Sales with a Bar Chart in Excel AI
Track Monthly Sales Trends in Seconds with Excel AI Line Chart
Compare Brand Sales Trends with Multi-Line Chart in Excel AI
How to Instantly Spot Repeat Buyers vs Newbies Using AI Charts
Which Products Are Going Viral? Track Popularity Momentum with AI Charts


