Key Takeaways
- The Efficiency Bottleneck: Manually creating charts is a tedious, time-consuming process that cripples timely analysis, especially when frequent updates are needed.
- A Paradigm Shift: AI chart generators shift the focus from "how to build the chart" to "what questions to ask," empowering you to concentrate on business insights.
- The Core Value: These tools dramatically boost visualization efficiency, eliminate the technical barrier, and empower more team members to uncover insights from data.
- Tool Selection: From lightweight AI assistants to enterprise-grade BI platforms, choosing the right tool for your team's needs is crucial.
Picture this: it's Monday morning, 15 minutes before your weekly sync-up. A Slack notification from your boss pops up: "Can you quickly pull a chart comparing last quarter's sales by region against our targets?"
You dive into a massive Excel file, frantically wrestling with pivot tables, filtering dates, and tweaking chart settings. By the time you finally paste the chart into your presentation, the meeting has already started.
This last-minute scramble is just the tip of the iceberg. The real drain is the routine work: the weekly, monthly, and quarterly reports that require hours, or even days, of repetitive labor. Because manually exploring different analytical angles is so cumbersome, we often settle for the most basic visualizations, leaving valuable insights undiscovered.
What is an AI Chart Generator and Why is it a Game-Changer?
An AI chart generator is a tool that understands natural language commands to automatically process data and create visualizations. It’s a game-changer because it fundamentally redefines your relationship with data.
It liberates you from the role of "tool operator" and elevates you to "business strategist." You no longer need to memorize complex formulas or hunt through menus. You simply ask questions:
- "Compare the sales trends for Product A and Product B over the last six months."
- "Show me the sales revenue split between new and returning customers in a pie chart."
- "Generate a scatter plot to analyze the relationship between customer age and average order value."
The AI handles all the tedious data processing and charting in the background. This means you can invest 100% of your brainpower where it truly matters: interpreting results, spotting trends, and making strategic decisions.
The 6 Best AI Chart Generators to Try
After reviewing numerous tools, we've handpicked the top 6 mainstream options. Each has a distinct focus, allowing you to quickly find the best fit for your team.
1. Excelmatic

- Positioning: The Go-To AI Assistant for power users who live and breathe Excel.
- Advantages: Lets you upload Excel/CSV files and use natural language to ask questions. It intelligently understands business jargon like "month-over-month growth" and generates charts in seconds.
2. Microsoft Copilot for Excel

- Positioning: The native AI assistant fully integrated into the Microsoft 365 ecosystem.
- Advantages: Works seamlessly within Excel via a side panel for quick generation of formulas, pivot tables, and charts.
3. ChatGPT

- Positioning: The ultimate flexible tool for custom Python-based visualizations.
- Advantages: Upload a dataset and use natural language to direct it to perform almost any data manipulation and visualization, making it ideal for non-standard, custom charts.
4. Tableau

- Positioning: The enterprise-grade AI for complex BI dashboards and deep-dive analytics.
- Advantages: Excels at handling massive datasets. The AI proactively discovers insights, recommends optimal chart types, and builds complex calculations from natural language.
5. Duet AI in Google Workspace
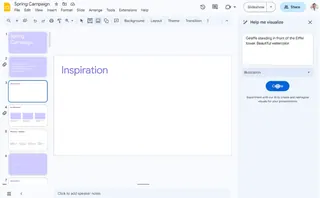
- Positioning: Google’s native AI assistant for its Sheets and Looker Studio users.
- Advantages: Its biggest strength is its seamless integration with the Google ecosystem. It can quickly organize data in Google Sheets or accelerate dashboard creation in Looker Studio.
6. Julius AI

- Positioning: An all-in-one "AI data analyst" capable of advanced statistical analysis.
- Advantages: Supports various data sources and can handle multi-step tasks like data cleaning and modeling through conversation, providing Python code for full transparency.
Frequently Asked Questions (FAQ)
Q1: Is my business data secure when I upload it?
A: Reputable tools, including Excelmatic, stake their reputation on this. They all promise enterprise-grade encryption and pledge not to use your data for public model training. Still, it's always wise to review their Privacy Policy for peace of mind.
Q2: Are the AI-generated charts accurate?
A: Yes. The AI is an executor; its output quality depends on your input quality. Top tools even provide the underlying code for you to verify each step.
Q3: Will AI replace data analysts?
A: No. AI automates the repetitive "chart-making," freeing up analysts to focus on higher-value work like interpretation and strategic advising. It’s a powerful co-pilot, not a replacement.
Stop Charting, Start Analyzing
The future of data visualization isn’t about software tricks; it's about insightful questions. AI chart generators are the key to unlocking this future.
As managers and analysts, our value lies in insight and decision-making. It’s time to offload the grunt work to AI and invest our energy where it creates real business value.
If your workday revolves around spreadsheets, a tool designed specifically for that environment is your best starting point.
Try Excelmatic today and reclaim the hours you've been losing to manual charting.

