Key takeaways:
- AI chart generation tools automatically transform the Excel or CSV data you export from marketing platforms into clear, intuitive charts without manual formatting.
- These tools use AI to suggest the best visualization types, helping you quickly identify which marketing campaigns are performing best.
- By automating chart creation, you can reduce hours of weekly reporting time to mere minutes, allowing you to focus on strategic analysis instead of repetitive design work.
Are your weekly marketing reports still just a jumble of screenshots and numbers? The marketing department's spreadsheets are overflowing with data from every channel: user growth, click-through rates, conversion costs... But when your boss or client asks, "So, how did we really do last month?" these cold numbers often fall flat. They're like a collection of scattered words, unable to form a compelling sentence.
This is where AI chart generation tools come in. They aren't just simple charting software; they're your data interpreters, capable of "translating" dull spreadsheets into a powerful visual story that anyone can understand. Below, we'll walk you through the top AI chart generation tools to help you say goodbye to boring reports and let your marketing data truly speak.
What are AI chart generation tools?
AI chart generation tools are software applications that combine artificial intelligence with data visualization techniques to automatically convert your data files (like Excel and CSV) into various charts. Unlike traditional chart-making methods, these tools integrate machine learning algorithms that understand the content and structure of your data to intelligently recommend the most suitable chart format.
They don't just show you the data—they help you understand what it means. AI tools can quickly identify trends, comparisons, and key data points, saving you significant time on data filtering and chart design.
For example, instead of manually setting up axes, colors, and legends in Excel to compare two ad campaigns, you can simply drag the data table into an AI tool. It will automatically generate a comparative bar chart, possibly even highlighting the better-performing campaign.
Key features of AI chart generation tools
These tools are designed for marketers, operations staff, and any non-technical professional who works with data. Most offer a minimalist user interface and AI-driven suggestions, making it easy for anyone to discover value in their data. Here's a sample of what these tools can do:
- One-click upload & analysis: Directly upload Excel, CSV files, or connect to Google Sheets, and the tool will automatically read and parse the data.
- Smart chart recommendations: Based on your data's characteristics (like time series, categories, or proportions), the AI automatically suggests the best chart type.
- Natural language interaction: You can ask questions in plain language (e.g., "show user growth by channel last month"), and the tool will generate the corresponding chart.
- Customization & beautification: Provides a rich library of templates and color palettes to easily create professional, on-brand visuals.
- Interactive charts: The generated charts are not static images; users can click, filter, and drill down to explore deeper layers of data.
- Data storytelling: Allows you to combine multiple charts into a dashboard to tell a complete story about a marketing campaign.
Benefits of using AI chart generation tools
AI chart generation tools are changing how marketing teams interpret and report on their work. They combine automation, intelligence, and aesthetics to make extracting valuable insights easier than ever. Here are some of the top benefits:
- Massive time savings: Reduces the hours spent on creating marketing reports to just a few minutes.
- More persuasive reports: A vivid, clear chart is far more compelling to your boss and clients than dense tables of numbers.
- Faster insights: The AI can automatically highlight outliers or key trends in your data, helping you spot problems or opportunities instantly.
- Zero technical barrier: Marketers can perform high-quality data analysis independently, without needing to learn complex Excel functions or BI software.
- Professionalism and consistency: Team members can share templates and styles to ensure a unified visual identity across all external reports.
- Easy collaboration & sharing: Easily generate a shareable link or embed charts into your presentations, Notion pages, or internal websites for team discussion.
What to consider when choosing an AI chart generation tool
Switching to a new tool means investing time in changing your reporting habits, but the payoff after the initial adjustment period is huge. Your marketing insights become clearer, and the automation turns complex spreadsheets into visual masterpieces that everyone will praise.
- Data source compatibility: Ensure the tool supports your common file formats (Excel, CSV) or can connect directly to your data sources (like Google Analytics or Google Sheets).
- Ease of use: Is the interface intuitive? How much time will it take to learn? Choose a platform that feels like "plug-and-play."
- Aesthetics and customization: The visual quality of your charts directly impacts your report's quality. Check if the tool offers high-quality templates and how much you can customize colors, fonts, and layouts.
- The "intelligence" of the AI: Are its smart recommendations actually useful? Can it understand simple natural language commands? This is what separates a basic chart tool from a true AI tool.
- Sharing and collaboration features: Can you easily share charts with colleagues or embed them in other applications?
- Pricing: Understand the pricing model. Is it freemium, a monthly subscription, or pay-per-chart? Choose a plan that fits your budget.
5 AI Chart Tools That Let Your Marketing Data Speak
The market offers a variety of AI chart generation tools, from comprehensive industry platforms to innovative tools focused on specific chart types or interactive experiences. Each has its own unique charm, and one is sure to meet your marketing data visualization needs.
1. Excelmatic

Excelmatic positions itself as the magician that gives your spreadsheets AI wings. It's laser-focused on solving one core problem: enabling average Excel users to get instant data insights and beautiful charts without any complex steps. Its workflow is so simple it has a near-zero learning curve. You just upload your Excel file, and its AI engine immediately gets to work, automatically analyzing the data and generating an interactive dashboard with multiple charts and key metrics. It's perfect for marketers who want to escape the tediousness of Excel's chart setup and get results with a single click.
- Key features:
- One-click dashboard generation: Upload an Excel file to get a complete, multi-chart dashboard, not just a single chart.
- AI-powered summaries: In addition to charts, it uses natural language to summarize key findings, like "The top-performing sales channel this month was..."
- Interactive exploration: The generated dashboard is dynamic; you can click on a section of one chart, and all other charts will update accordingly.
- Built for spreadsheets: Optimized for handling electronic-sheet data, with excellent compatibility for common marketing data formats.
- Effortless sharing: The dashboard can be easily shared via a link with colleagues or clients, no software installation required.
2. Chart-GPT.dev

If you're familiar with ChatGPT, then Chart-GPT.dev will feel like ChatGPT built for data visualization. Its core philosophy is creating charts through conversation. You just upload your Excel file and then tell it what you want in natural language. For example, after uploading a spreadsheet with social media follower growth, you can simply type: "Create a line chart comparing the follower growth trends for Facebook and Instagram over the last 30 days." It’s an excellent experience for those who don’t want to click any buttons and prefer to get work done just by "talking."
- Key features:
- Conversational chart generation: Create and modify charts entirely through natural language commands.
- Smart data recognition: Automatically identifies dates, categories, and values, so you don't have to manually specify data series.
- Instant preview & modification: Generates charts in real-time as you type, and you can continue the conversation to adjust colors, titles, etc.
- Code export: Supports exporting charts as React, Vue, and other front-end code for easy developer integration.
- Minimalist interface: Besides an upload button and a chat box, there are almost no superfluous elements.
3. Graphy

Graphy is like a shared digital whiteboard for your data team. It's not just a simple chart generator, but a collaborative data workspace where your marketing, operations, and data teams can work together. You can connect to live databases or upload Excel files, then arrange text notes, SQL queries, and interactive charts in a single document, much like you would in Notion or Google Docs. It perfectly solves the collaboration problem of having "data in one place and discussion in another."
- Key features:
- Collaborative Canvas: Team members can edit and comment in the same document in real-time.
- Mixed Content Blocks: Seamlessly organize text, code (SQL), and visual charts together.
- Direct Data Connections: Supports connections to modern data warehouses like Snowflake and BigQuery for real-time data sync.
- Template-Driven: Provides a rich library of templates, such as "Marketing Campaign Analysis," to help you get started quickly.
- Storytelling Presentation: Weaves your analysis process and results into a clear data story, rather than scattered charts.
4. Canva

If other tools focus on "analysis," Canva's focus is on "beauty." It's like a marketing designer's magic wand, capable of turning bland data charts into stunning infographics. While its AI analysis capabilities aren't as strong as specialized tools, its AI shines in "design intelligence." You just input your data (or upload a CSV), and it will match you with the most suitable visual style from its massive library of templates, allowing you to create a beautiful chart for social media or a high-end report in minutes.
- Key features:
- Massive library of aesthetic templates: Offers thousands of chart and infographic templates created by professional designers.
- AI-powered template recommendations: Intelligently suggests the best design templates based on your data and brand colors.
- Drag-and-drop editing: An incredibly simple interface allows you to change icons, colors, and fonts at will.
- Data and design fusion: It's not just about charts; you can easily combine them with images, text, and illustrations.
- Multi-format export: Supports exporting as images, PDFs, or directly generating sizes optimized for social media posts.
5. Quadratic
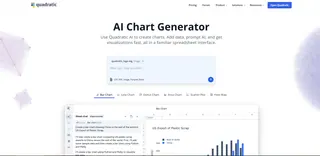
Quadratic looks like a normal spreadsheet, but it hides a powerful rocket engine under the hood. It provides the perfect bridge for users who are familiar with Excel but crave more powerful analytics. Its revolutionary feature is the ability to use traditional spreadsheet formulas, Python code, and SQL queries all within the same cells. For marketers, this means you can perform complex analyses (like user segmentation with Python) in a familiar environment, eliminating the need to export data to another tool.
- Key features:
- Infinite Canvas Spreadsheet: Offers a familiar grid interface but without the limits on rows and columns.
- Multi-Language Cells: Seamlessly integrate Python, SQL, and Excel formulas within the same sheet.
- High-Performance Data Processing: Engineered to handle massive datasets with a smooth, lag-free experience.
- Real-Time Collaboration: Just like Google Sheets, it supports simultaneous online editing by team members.
- Native Chart Integration: Create interactive charts directly from the complex data you've analyzed with Python or SQL.
Frequently Asked Questions (FAQs) About AI Chart Tools
Can these AI tools handle very complex or large Excel files?
For daily marketing report data (within a few thousand rows), most of these tools perform smoothly. For extremely large (hundreds of thousands of rows) or structurally complex datasets, you might need a more professional BI tool (like Tableau or Power BI). However, for 90% of marketers, these lightweight AI tools are more than sufficient.
Is my data secure? Will it be leaked if I upload it to these platforms?
This is a very important question. Most well-known commercial tools (like Microsoft, Google, and Canva) have strict data privacy policies and security measures. For some emerging independent tools, it's recommended to read their privacy terms carefully before uploading highly sensitive company data.
Can I use these charts directly in my PowerPoint presentations?
Absolutely! This is one of the core values of these tools. They typically support exporting to PNG, JPG, or SVG formats, allowing you to directly insert these high-definition, beautiful charts into PowerPoint, Keynote, or Google Slides. They are much clearer and more professional than screenshots of Excel charts.
Move Beyond Static Charts and Unlock Your Data’s Full Potential with Excelmatic
You’ve just seen how AI is revolutionizing data visualization. Now, it's time to experience it firsthand. Excelmatic is built for marketers, sales managers, and business analysts just like you, designed to eliminate all the friction between a raw Excel file and a beautiful, interactive dashboard. We believe that powerful data insights shouldn't be locked behind complex software or high costs.
No configuration, no coding—just upload your file to instantly get a dashboard you can share, explore, and use to tell your data's story.
Key Advantages:
- Seconds, Not Hours: Go from upload to insight in seconds.
- AI-Powered Storyteller: Automatically generates data summaries that tell you the most important conclusions.
- Fully Interactive Experience: Ditch static images and let your team freely drill down and explore the data.
- Seamless Collaboration & Sharing: Create a secure link with one click to easily share with anyone, on any device.
- Built for Spreadsheets: Deeply optimized to be perfectly compatible with the Excel and CSV files you use every day.
Try Excelmatic for free today and see your data reports transform before your eyes. For enterprise deployments, private solutions, or integration needs, contact our solution experts to learn how we can build a powerful data visualization engine tailored for you.

