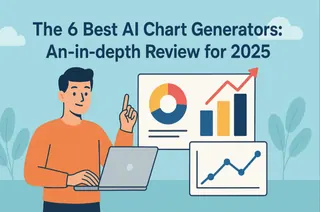
If your job involves data, you know this story all too well. You need to present your findings, but first, you must survive the gauntlet of spreadsheet challenges:
- The data is a disaster. You waste hours cleaning and formatting before you can even begin to analyze.
- You're paralyzed by choice, endlessly debating whether a bar, line, or scatter plot best tells your story.
- The chart is finally done, but now you have to write the "so what?"—the key insight that gives it meaning, and you're drawing a blank.
Stop wrestling with your spreadsheets alone. This entire workflow is being revolutionized by AI. The real question isn't if you should use AI, but which tool is the genuine productivity machine you need.
I’ve put dozens of AI tools to the test. These are the 10 that have earned a permanent place in my workflow.
1. Excelmatic

Best for: End-to-end analysis from a raw file to a complete report.
Why you'll love it: It's a true all-in-one tool. Ask a question, and it cleans, calculates, charts, and writes the insights for you.
Keep in mind: Web-based platform. Free trial available, Pro plan is $9.9/month.
✅ The fastest path from a messy spreadsheet to a clear, data-driven story.Try Excelmatic for free today
2. ChatGPT

Best for: Custom code, complex problems, and brainstorming.
Why you'll love it: Generates Python code for unique charts and helps debug complex formulas or structure reports.
Keep in mind: Requires a Plus subscription. Delivers code or ideas, not a direct image file.
✅ Your creative co-pilot for any problem that standard tools can't solve.
3. Microsoft Copilot in Excel

Best for: AI assistance without ever leaving your Excel worksheet.
Why you'll love it: The integration is perfectly seamless, offering a smooth and secure workflow right inside your spreadsheet.
Keep in mind: High enterprise cost. Analytical capabilities are currently more basic.
✅ The no-brainer choice for companies deeply invested in the Microsoft 365 ecosystem.
4. Tableau

Best for: Exploring massive datasets with natural language in a professional BI tool.
Why you'll love it: Its "Ask Data" feature provides instant visualizations and can automatically explain the drivers behind data spikes.
Keep in mind: Steep learning curve and high cost, making it best for dedicated analysts.
✅ A powerful catalyst when you're doing serious, in-depth business intelligence.
5. Looker Studio

Best for: Building free, live, and interactive dashboards from multiple data sources.
Why you'll love it: It's powerful, flexible, and connects to almost anything, all for free.
Keep in mind: It’s a manual dashboard builder, not an instant AI analysis tool.
✅ The undisputed king for creating dynamic monitoring dashboards at no cost.
6. Rows

Best for: Using AI functions directly inside spreadsheet cells.
Why you'll love it: The unique =AI() function integrates AI for research, text analysis, and data enrichment right into your workflow.
Keep in mind: A standalone spreadsheet platform, not an Excel add-in.
✅ If you wish your spreadsheet itself had AI superpowers, this is for you.
7. Canva

Best for: Creating stylish, on-brand charts for presentations and marketing materials.
Why you'll love it: Prioritizes speed and aesthetics, seamlessly integrating with Canva's design ecosystem.
Keep in mind: Purely a visual tool with virtually no analytical capabilities.
✅ Your go-to when you need a chart that looks great in under 60 seconds.
8. Beautiful.ai

Best for: AI-powered presentation design that automatically handles chart layouts.
Why you'll love it: You focus on the data and narrative; the AI ensures every slide looks clean and professional.
Keep in mind: It's a presentation tool first, so chart customization is limited.
✅ A huge time-saver if you want your entire presentation to look amazing.
9. Datawrapper
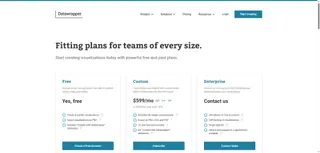
Best for: Publication-quality, interactive charts and maps for formal reports.
Why you'll love it: Creates exceptionally professional and clean charts. Its free tier is generous and adds no watermarks.
Keep in mind: A specialized editor, not an analysis engine. You need to bring clean data.
✅ The tool to use when the final polish and accuracy of your chart are paramount.
10. Notion AI
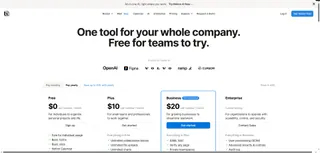
Best for: Summarizing data tables and writing the narrative around your visuals.
Why you'll love it: It excels at text generation, making it the perfect assistant for drafting insights and executive summaries.
Keep in mind: It can't create charts, only process the text and data behind them.
✅ Ask Notion AI for help when your chart is done but the page is blank.
Quick Summary
Short on time? Here’s the cheat sheet. Pick your primary goal and find your perfect tool.
| If your primary goal is to... | The best tool is... |
|---|---|
| Quickly turn raw data into a chart + story | Excelmatic |
| Create highly custom visuals with code | ChatGPT |
| Work seamlessly and securely inside Excel | Microsoft Copilot |
| Build a free, powerful, interactive dashboard | Looker Studio |
| Design beautiful charts for publication | Datawrapper |
Final Thoughts
Today, AI acts as a tireless co-pilot. It frees us from that drudgery, allowing us to dedicate our full brainpower to what truly matters: thinking strategically, uncovering deeper insights, and telling a compelling data story. AI isn't replacing our thinking; it's amplifying it, giving us the leverage to operate at a higher level.
The only way to understand the power of these tools is to use them. Pick one from this list that piques your interest—starting with a free trial of Excelmatic—and experience for yourself what it feels like to put your productivity on steroids.

