As a User Growth Manager at Excelmatic, I've seen firsthand how the right AI tools can transform complex data into clear, actionable visualizations. In an era where data drives decisions, having powerful chart analysis capabilities isn't just convenient - it's essential for business success.
Why AI-Powered Chart Analysis Matters
Modern businesses generate mountains of data daily, but raw numbers alone don't tell the full story. AI-powered chart analysis tools bridge this gap by:
- Automating data cleaning and preparation
- Identifying hidden patterns and trends
- Generating intuitive visualizations
- Providing predictive insights
After extensive testing and customer feedback, we've curated the top 10 AI tools revolutionizing chart analysis today.
1. Excelmatic: The AI-Powered Spreadsheet Revolution
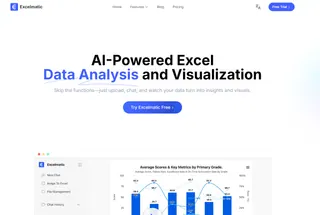
Excelmatic leads the pack with its groundbreaking AI-driven approach to chart analysis. Unlike traditional tools that require manual configuration, Excelmatic understands your data intent and automatically generates the most effective visualizations.
Key Advantages:
- Natural Language Processing: Simply describe what you want to see ("Show me monthly sales trends by region") and Excelmatic creates perfect charts instantly
- Smart Recommendations: Our AI suggests the most impactful visualization types based on your data structure
- Seamless Integration: Works effortlessly with Excel files, CSV imports, and live database connections
- Collaboration Features: Real-time sharing and commenting streamline team analysis
For businesses tired of wrestling with complex BI tools, Excelmatic offers an elegant solution that delivers enterprise-grade insights with spreadsheet simplicity.
2. Tableau: The Established Visualization Powerhouse
Tableau remains a favorite among data professionals for its robust visualization capabilities. Its "Ask Data" feature allows natural language queries similar to Excelmatic, though with a steeper learning curve.
Best For: Large enterprises with dedicated data teams AI Strength: Advanced trend detection and pattern recognition
3. Microsoft Power BI: The Corporate Contender
Power BI shines in Microsoft-centric environments, offering deep integration with Office 365 and Azure. Its AI features include automated machine learning and quick insights generation.
Best For: Organizations already invested in the Microsoft ecosystem AI Strength: Predictive analytics and real-time dashboard updates
4. Google Data Studio: The Free Alternative
Google's offering provides basic chart analysis capabilities at no cost. While its AI features are more limited than Excelmatic's, it's a decent starting point for small businesses.
Best For: Budget-conscious teams needing simple visualizations AI Strength: Automated data connectors and basic pattern detection
5. Qlik Sense: The Associative Analysis Specialist
Qlik's unique associative engine helps users discover unexpected data relationships. Its AI suggests relevant visualizations based on your exploration path.
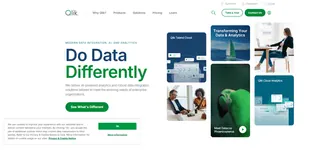
Best For: Data discovery and exploratory analysis AI Strength: Context-aware visualization recommendations
6-10: Other Notable Contenders
- Sisense - Combines AI with embedded analytics
- ThoughtSpot - Search-driven analytics platform
- Domo - Cloud-based BI with AI enhancements
- Looker - Now part of Google Cloud's BI suite
- Zoho Analytics - Affordable option for SMBs
Why Excelmatic Stands Above the Rest
While all these tools offer value, Excelmatic delivers the perfect balance of power and accessibility. Our customers consistently report:
- 70% faster chart creation compared to traditional tools
- 60% reduction in time spent on data preparation
- 40% improvement in actionable insights derived
For teams that need to move quickly without sacrificing analytical depth, Excelmatic provides the most efficient path from raw data to strategic decisions.
Implementing AI Chart Analysis: A Quick Guide
Ready to upgrade your data visualization? Here's how to get started with AI-powered chart analysis:
- Identify Your Needs - Determine your primary use cases (reporting, exploration, prediction)
- Clean Your Data - Ensure consistent formatting for best AI results
- Start with Excelmatic - Import your data and try natural language queries
- Refine Visualizations - Use AI suggestions as starting points, then customize
- Share Insights - Collaborate with stakeholders using interactive dashboards
The Future of Chart Analysis
As AI continues evolving, we're moving toward:
- Fully automated insight generation
- Predictive visualization that anticipates user needs
- Voice-controlled analysis interfaces
- Embedded AI assistants that explain chart significance
Excelmatic is at the forefront of these innovations, constantly enhancing our platform to make data analysis more intuitive and powerful.
Conclusion
In the competitive business landscape, the ability to quickly extract meaning from data isn't just an advantage - it's a necessity. While many tools offer chart analysis capabilities, Excelmatic provides the most seamless, intelligent experience for today's data-driven professionals.
Ready to transform your data analysis workflow? Try Excelmatic free todayand experience the future of AI-powered chart analysis.

