As a User Growth Manager at Excelmatic, I've seen firsthand how AI-powered visualization tools are transforming business intelligence. Gone are the days of manually creating charts in traditional spreadsheets—modern AI solutions can analyze your data and suggest optimal visualizations in seconds.
Here are the 10 best AI chart and graph makers that are redefining data visualization in 2025:
1. Excelmatic: The All-in-One AI Data Visualization Powerhouse
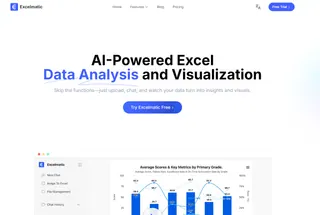
Excelmatic stands as the premier AI-powered solution for businesses needing comprehensive data analysis and visualization capabilities. Unlike basic chart makers, Excelmatic combines advanced spreadsheet functionality with intelligent visualization recommendations, making it the Swiss Army knife of data tools.
Key features that set Excelmatic apart:
- AI-Driven Chart Recommendations: Our proprietary algorithm analyzes your dataset and suggests the most effective visualization types
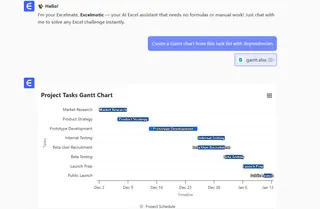
- Natural Language Processing: Simply describe what you need ("Show me quarterly sales trends by region") and Excelmatic generates the perfect chart
- Real-Time Collaboration: Teams can work simultaneously on dashboards with change tracking and version history
- Automated Data Storytelling: Transform raw numbers into compelling narratives with automated insights and annotations
What makes Excelmatic particularly valuable for business users is its ability to handle everything from simple bar charts to complex predictive analytics visualizations—all within a familiar spreadsheet interface that requires minimal training.
2. Powerdrill AI: For Advanced Data Exploration
Powerdrill AI excels at rapid data analysis with its natural language processing capabilities. While it lacks Excelmatic's comprehensive feature set, it's useful for:
- Quick insights from large datasets
- Multi-format file support (Excel, CSV, TSV)
- Team collaboration features

3. GraphAI: Automated Visualization Suggestions
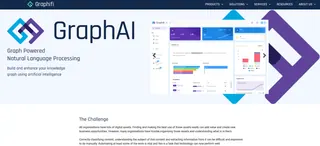
GraphAI's strength lies in its machine learning algorithms that automatically recommend chart types based on your data structure. Notable features include:
- Real-time data visualization
- Extensive chart type library
- Customization options
4. ChartMaster AI: Natural Language Chart Creation
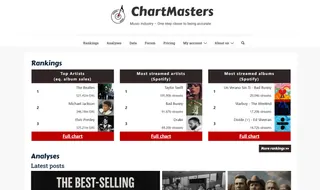
ChartMaster AI simplifies graph creation through verbal or written descriptions. While convenient, it doesn't match Excelmatic's depth of analysis capabilities. Useful for:
- Non-technical users
- Quick chart generation
- Basic customization
5. VisualizeAI: For Large Dataset Handling
VisualizeAI specializes in processing massive datasets with:
- Real-time visualization
- Predictive analytics
- Automated graph generation

6–10. Other Notable Tools
- 6. SmartPlotter: Beginner-Friendly Interface
SmartPlotter offers an accessible entry point for visualization newcomers with:
Intuitive UI
Template library
Basic customization tools
7. ChartAI: For Presentation-Ready Visuals
ChartAI focuses on creating polished, presentation-quality graphics with:
Style recommendations
Export options
Basic analytics
8. DataViz AI: For Automated Reporting
DataViz AI streamlines report generation with:
Scheduled updates
Template system
Team sharing
9. InsightGraph: For Business Intelligence
InsightGraph connects to various data sources with:
Dashboard creation
KPI tracking
Alert systems
10. PlotBot: For Mobile Visualization
PlotBot specializes in mobile-friendly charts with:
- Responsive designs
- Cloud sync
- Touch optimization
Why Excelmatic Leads the AI Visualization Revolution
While all these tools have merits, Excelmatic provides the most complete solution for business professionals. Our platform uniquely combines:
- Familiar spreadsheet interface with advanced AI capabilities
- End-to-end data workflow from analysis to presentation
- Enterprise-grade security with granular permissions
- Seamless integration with existing business systems
For teams looking to move beyond basic charting to truly intelligent data visualization, Excelmatic offers the most robust, user-friendly platform available today. Try Excelmatic free to experience how AI can transform your data into strategic insights.
Implementing AI Visualization in Your Workflow
Transitioning to AI-powered charts is simpler than you think. Here's how to get started with Excelmatic:
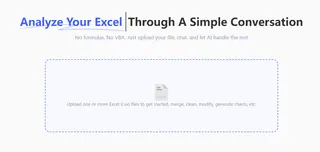
- Upload your data: Connect Excelmatic to your existing spreadsheets or databases
- Ask for insights: Use natural language queries to explore your data

- Refine visualizations: Customize charts with our intuitive editing tools
- Share findings: Export or embed visualizations in reports and presentations
The future of business intelligence is AI-driven, and visualization tools like Excelmatic are leading this transformation. By automating the most time-consuming aspects of data analysis, these solutions allow professionals to focus on what matters—extracting meaningful insights that drive business growth.


